Last updated September 18, 2024

| 1. | United States | $25.5T | |
| 2. | China | $17.9T | |
| 3. | Japan | $4.2T | |
| 4. | Germany | $4.1T | |
| 5. | India | $3.4T | |
| 6. | United Kingdom | $3.1T | |
| 7. | France | $2.8T | |
| 8. | Russia | $2.2T | |
| 9. | Canada | $2.1T | |
| 10. | Italy | $2.1T | |
| 11. | Brazil | $1.9T | |
| 12. | Australia | $1.7T | |
| 13. | South Korea | $1.6T | |
| 14. | Mexico | $1.4T | |
| 15. | Spain | $1.4T | |
| 16. | Indonesia | $1.3T | |
| 17. | Saudi Arabia | $1.1T | |
| 18. | Netherlands | $991.1B | |
| 19. | Turkey | $906.0B | |
| 20. | Switzerland | $807.7B | |
| 21. | Poland | $688.2B | |
| 22. | Argentina | $632.8B | |
| 23. | Sweden | $585.9B | |
| 24. | Norway | $579.3B | |
| 25. | Belgium | $578.6B | |
| 26. | Ireland | $529.2B | |
| 27. | Israel | $522.0B | |
| 28. | United Arab Emirates | $507.5B | |
| 29. | Thailand | $495.3B | |
| 30. | Nigeria | $477.4B | |
| 31. | Egypt | $476.7B | |
| 32. | Austria | $471.4B | |
| 33. | Singapore | $466.8B | |
| 34. | Bangladesh | $460.2B | |
| 35. | Vietnam | $408.8B | |
| 36. | Malaysia | $406.3B | |
| 37. | South Africa | $405.9B | |
| 38. | Philippines | $404.3B | |
| 39. | Denmark | $395.4B | |
| 40. | Iran | $388.5B | |
| 41. | Pakistan | $376.5B | |
| 42. | Hong Kong | $359.8B | |
| 43. | Colombia | $343.9B | |
| 44. | Romania | $301.3B | |
| 45. | Chile | $301.0B | |
| 46. | Czech Republic | $290.9B | |
| 47. | Finland | $280.8B | |
| 48. | Iraq | $264.2B | |
| 49. | Portugal | $251.9B | |
| 50. | New Zealand | $247.2B | |
| 51. | Peru | $242.6B | |
| 52. | Qatar | $237.3B | |
| 53. | Kazakhstan | $220.6B | |
| 54. | Greece | $219.1B | |
| 55. | Algeria | $191.9B | |
| 56. | Kuwait | $184.6B | |
| 57. | Hungary | $178.8B | |
| 58. | Ukraine | $160.5B | |
| 59. | Morocco | $134.2B | |
| 60. | Ethiopia | $126.8B | |
| 61. | Slovakia | $115.5B | |
| 62. | Ecuador | $115.0B | |
| 63. | Oman | $114.7B | |
| 64. | Dominican Republic | $113.6B | |
| 65. | Kenya | $113.4B | |
| 66. | Angola | $106.7B | |
| 67. | Guatemala | $95.0B | |
| 68. | Bulgaria | $89.0B | |
| 69. | Luxembourg | $82.3B | |
| 70. | Uzbekistan | $80.4B | |
| 71. | Azerbaijan | $78.7B | |
| 72. | Panama | $76.5B | |
| 73. | Tanzania | $75.7B | |
| 74. | Sri Lanka | $74.4B | |
| 75. | Ghana | $72.8B | |
| 76. | Belarus | $72.8B | |
| 77. | Uruguay | $71.2B | |
| 78. | Croatia | $71.0B | |
| 79. | Lithuania | $70.3B | |
| 80. | Ivory Coast | $70.0B | |
| 81. | Costa Rica | $68.4B | |
| 82. | Serbia | $63.5B | |
| 83. | Slovenia | $62.1B | |
| 84. | Myanmar | $59.4B | |
| 85. | DR Congo | $58.1B | |
| 86. | Sudan | $51.7B | |
| 87. | Jordan | $47.5B | |
| 88. | Tunisia | $46.7B | |
| 89. | Libya | $45.8B | |
| 90. | Uganda | $45.6B | |
| 91. | Bahrain | $44.4B | |
| 92. | Cameroon | $44.3B | |
| 93. | Bolivia | $43.1B | |
| 94. | Paraguay | $41.7B | |
| 95. | Latvia | $41.2B | |
| 96. | Nepal | $40.8B | |
| 97. | Estonia | $38.1B | |
| 98. | El Salvador | $32.5B | |
| 99. | Honduras | $31.7B | |
| 100. | Papua New Guinea | $30.6B | |
| 101. | Cambodia | $30.0B | |
| 102. | Zambia | $29.8B | |
| 103. | Cyprus | $28.4B | |
| 104. | Trinidad and Tobago | $27.9B | |
| 105. | Iceland | $27.8B | |
| 106. | Senegal | $27.7B | |
| 107. | Georgia | $24.6B | |
| 108. | Bosnia and Herzegovina | $24.5B | |
| 109. | Macau | $22.0B | |
| 110. | Guinea | $21.2B | |
| 111. | Gabon | $21.1B | |
| 112. | Zimbabwe | $20.7B | |
| 113. | Botswana | $20.4B | |
| 114. | Haiti | $20.3B | |
| 115. | Armenia | $19.5B | |
| 116. | Palestine | $19.1B | |
| 117. | Burkina Faso | $18.9B | |
| 118. | Albania | $18.9B | |
| 119. | Mali | $18.8B | |
| 120. | Mozambique | $17.9B | |
| 121. | Malta | $17.8B | |
| 122. | Benin | $17.4B | |
| 123. | Jamaica | $17.1B | |
| 124. | Mongolia | $16.8B | |
| 125. | Brunei | $16.7B | |
| 126. | Laos | $15.7B | |
| 127. | Nicaragua | $15.7B | |
| 128. | Guyana | $15.4B | |
| 129. | Madagascar | $15.0B | |
| 130. | DR Congo | $14.6B | |
| 131. | Moldova | $14.4B | |
| 132. | Niger | $14.0B | |
| 133. | North Macedonia | $13.6B | |
| 134. | Rwanda | $13.3B | |
| 135. | Malawi | $13.2B | |
| 136. | Mauritius | $12.9B | |
| 137. | Bahamas | $12.9B | |
| 138. | Chad | $12.7B | |
| 139. | Namibia | $12.6B | |
| 140. | Equatorial Guinea | $11.8B | |
| 141. | Kyrgyzstan | $10.9B | |
| 142. | Tajikistan | $10.5B | |
| 143. | Mauritania | $10.4B | |
| 144. | Togo | $8.1B | |
| 145. | Maldives | $6.2B | |
| 146. | Montenegro | $6.1B | |
| 147. | Barbados | $5.6B | |
| 148. | Fiji | $4.9B | |
| 149. | Eswatini | $4.9B | |
| 150. | Liberia | $4.0B | |
| 151. | Sierra Leone | $4.0B | |
| 152. | Suriname | $3.6B | |
| 153. | Andorra | $3.4B | |
| 154. | Timor Leste | $3.2B | |
| 155. | Burundi | $3.1B | |
| 156. | Belize | $2.8B | |
| 157. | Lesotho | $2.6B | |
| 158. | Central African Republic | $2.4B | |
| 159. | Cape Verde | $2.3B | |
| 160. | Gambia | $2.3B | |
| 161. | Saint Lucia | $2.1B | |
| 162. | Antigua and Barbuda | $1.8B | |
| 163. | Guinea Bissau | $1.6B | |
| 164. | Solomon Islands | $1.6B | |
| 165. | Seychelles | $1.6B | |
| 166. | Grenada | $1.3B | |
| 167. | Comoros | $1.2B | |
| 168. | Vanuatu | $983.6M | |
| 169. | Saint Kitts and Nevis | $961.6M | |
| 170. | Saint Vincent and the Grenadines | $948.6M | |
| 171. | Samoa | $832.4M | |
| 172. | Dominica | $612.0M | |
| 173. | Sao Tome and Principe | $546.7M | |
| 174. | Micronesia | $427.1M | |
| 175. | Marshall Islands | $279.7M | |
| 176. | Kiribati | $223.4M | |
| 177. | Tuvalu | $60.3M |
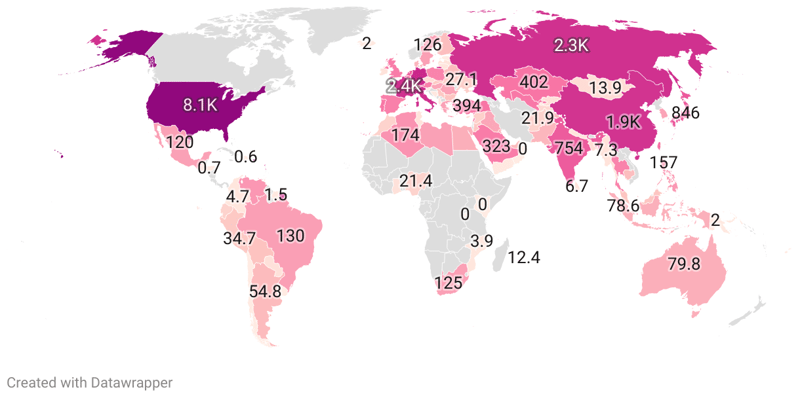
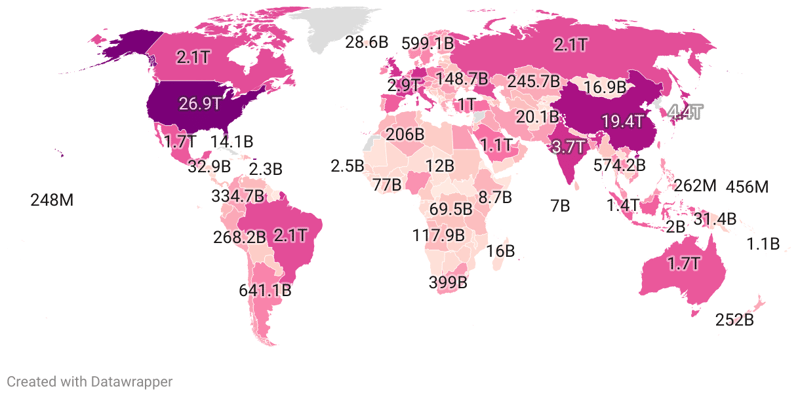
Gross Domestic Product (GDP) serves as a broad measure of a nation's overall economic activity, encompassing the market value of all finished goods and services in a certain timeframe. This critical economic indicator shows how countries perform and compete in the global economic arena. By looking at GDP data compiled by various reputable organizations like the International Monetary Fund, the World Bank, and the United Nations Statistics Division, we can discern patterns, understand regional differences, make predictions, and even craft policies informed by these insights.
The United States comfortably holds the number one position, with a GDP of a staggering $25.463 trillion. This is reflective of the country's advanced, diverse economy, which is underpinned by a strong entrepreneurial culture, an abundance of natural resources, and high labor market efficiency. The second place is claimed by China, with a GDP of $17.963 trillion. This Asian country's move towards a socialist market economy, streamlined by controlled privatization and deregulation strategies have largely contributed to this impressive statistic, surging its share of global nominal GDP from 2% in 1980 to 18% in 2021. Japan, at third position, has a GDP of $4.231 trillion. Germany follows closely with a GDP of $4.072 trillion, and India completes the top five with a GDP of $3.385 trillion. The United Kingdom, France, Russia, Canada, and Italy also feature in this top 10 list, each with GDPs ranging from $2.010 to $3.071 trillion. Highest GDP Countries:
Ranked in World
#118
$191.9B
Ranked in World
#55
Ranked in World
#153
$106.7B
Ranked in World
#66
Ranked in World
#162
$632.8B
Ranked in World
#22
Ranked in World
#115
Ranked in World
#12
$471.4B
Ranked in World
#32
Ranked in World
#71
Ranked in World
#137
Ranked in World
#91
$460.2B
Ranked in World
#34
Ranked in World
#147
Ranked in World
#76
$578.6B
Ranked in World
#25
Ranked in World
#156
Ranked in World
#122
Ranked in World
#93
Ranked in World
#108
Ranked in World
#113
Ranked in World
#11
Ranked in World
#125
Ranked in World
#68
Ranked in World
#117
Ranked in World
#155
Ranked in World
#101
Ranked in World
#92
Ranked in World
#9
Ranked in World
#159
Ranked in World
#158
Ranked in World
#138
$301.0B
Ranked in World
#45
Ranked in World
#2
$343.9B
Ranked in World
#43
Ranked in World
#167
Ranked in World
#81
Ranked in World
#78
Ranked in World
#103
$290.9B
Ranked in World
#46
Ranked in World
#85
Ranked in World
#130
Ranked in World
#85
Ranked in World
#130
$395.4B
Ranked in World
#39
$612.0M
Ranked in World
#172
$113.6B
Ranked in World
#64
$115.0B
Ranked in World
#62
$476.7B
Ranked in World
#31
Ranked in World
#98
Ranked in World
#140
Ranked in World
#97
Ranked in World
#149
$126.8B
Ranked in World
#60
Ranked in World
#148
$280.8B
Ranked in World
#47
Ranked in World
#7
Ranked in World
#111
Ranked in World
#160
Ranked in World
#107
Ranked in World
#4
Ranked in World
#75
$219.1B
Ranked in World
#54
Ranked in World
#166
Ranked in World
#67
Ranked in World
#110
Ranked in World
#163
Ranked in World
#128
Ranked in World
#114
Ranked in World
#99
$359.8B
Ranked in World
#42
$178.8B
Ranked in World
#57
Ranked in World
#105
Ranked in World
#5
Ranked in World
#16
$388.5B
Ranked in World
#40
$264.2B
Ranked in World
#48
$529.2B
Ranked in World
#26
$522.0B
Ranked in World
#27
Ranked in World
#10
Ranked in World
#80
Ranked in World
#123
Ranked in World
#3
Ranked in World
#87
$220.6B
Ranked in World
#53
$113.4B
Ranked in World
#65
$223.4M
Ranked in World
#176
$184.6B
Ranked in World
#56
Ranked in World
#141
Ranked in World
#126
Ranked in World
#95
Ranked in World
#157
Ranked in World
#150
Ranked in World
#89
Ranked in World
#79
Ranked in World
#69
Ranked in World
#109
Ranked in World
#129
Ranked in World
#135
$406.3B
Ranked in World
#36
Ranked in World
#145
Ranked in World
#119
Ranked in World
#121
$279.7M
Ranked in World
#175
Ranked in World
#143
Ranked in World
#136
Ranked in World
#14
$427.1M
Ranked in World
#174
Ranked in World
#131
Ranked in World
#124
Ranked in World
#146
$134.2B
Ranked in World
#59
Ranked in World
#120
Ranked in World
#84
Ranked in World
#139
Ranked in World
#96
$991.1B
Ranked in World
#18
$247.2B
Ranked in World
#50
Ranked in World
#127
Ranked in World
#132
$477.4B
Ranked in World
#30
Ranked in World
#133
$579.3B
Ranked in World
#24
$114.7B
Ranked in World
#63
$376.5B
Ranked in World
#41
Ranked in World
#116
Ranked in World
#72
Ranked in World
#100
Ranked in World
#94
$242.6B
Ranked in World
#51
$404.3B
Ranked in World
#38
$688.2B
Ranked in World
#21
$251.9B
Ranked in World
#49
$237.3B
Ranked in World
#52
$301.3B
Ranked in World
#44
Ranked in World
#8
Ranked in World
#134
$961.6M
Ranked in World
#169
Ranked in World
#161
$948.6M
Ranked in World
#170
$832.4M
Ranked in World
#171
$546.7M
Ranked in World
#173
Ranked in World
#17
Ranked in World
#106
Ranked in World
#82
Ranked in World
#165
Ranked in World
#151
$466.8B
Ranked in World
#33
$115.5B
Ranked in World
#61
Ranked in World
#83
Ranked in World
#164
$405.9B
Ranked in World
#37
Ranked in World
#13
Ranked in World
#15
Ranked in World
#74
Ranked in World
#86
Ranked in World
#152
$585.9B
Ranked in World
#23
$807.7B
Ranked in World
#20
Ranked in World
#142
Ranked in World
#73
$495.3B
Ranked in World
#29
Ranked in World
#154
Ranked in World
#144
Ranked in World
#104
Ranked in World
#88
$906.0B
Ranked in World
#19
Ranked in World
#177
Ranked in World
#90
$160.5B
Ranked in World
#58
$507.5B
Ranked in World
#28
Ranked in World
#6
Ranked in World
#1
Ranked in World
#77
Ranked in World
#70
$983.6M
Ranked in World
#168
$408.8B
Ranked in World
#35
Ranked in World
#102
Ranked in World
#112
| Region ↕ | Gross Domestic Product (GDP)↕ |
|---|---|
| $18.9B | |
| $191.9B | |
| $3.4B | |
| $106.7B | |
| $1.8B | |
| $632.8B | |
| $19.5B | |
| $1.7T | |
| $471.4B | |
| $78.7B | |
| $12.9B | |
| $44.4B | |
| $460.2B | |
| $5.6B | |
| $72.8B | |
| $578.6B | |
| $2.8B | |
| $17.4B | |
| $43.1B | |
| $24.5B | |
| $20.4B | |
| $1.9T | |
| $16.7B | |
| $89.0B | |
| $18.9B | |
| $3.1B | |
| $30.0B | |
| $44.3B | |
| $2.1T | |
| $2.3B | |
| $2.4B | |
| $12.7B | |
| $301.0B | |
| $17.9T | |
| $343.9B | |
| $1.2B | |
| $68.4B | |
| $71.0B | |
| $28.4B | |
| $290.9B | |
| $58.1B | |
| $58.1B | |
| $395.4B | |
| $612.0M | |
| $113.6B | |
| $115.0B | |
| $476.7B | |
| $32.5B | |
| $11.8B | |
| $38.1B | |
| $4.9B | |
| $126.8B | |
| $4.9B | |
| $280.8B | |
| $2.8T | |
| $21.1B | |
| $2.3B | |
| $24.6B | |
| $4.1T | |
| $72.8B | |
| $219.1B | |
| $1.3B | |
| $95.0B | |
| $21.2B | |
| $1.6B | |
| $15.4B | |
| $20.3B | |
| $31.7B | |
| $359.8B | |
| $178.8B | |
| $27.8B | |
| $3.4T | |
| $1.3T | |
| $388.5B | |
| $264.2B | |
| $529.2B | |
| $522.0B | |
| $2.1T | |
| $70.0B | |
| $17.1B | |
| $4.2T | |
| $47.5B | |
| $220.6B | |
| $113.4B | |
| $223.4M | |
| $184.6B | |
| $10.9B | |
| $15.7B | |
| $41.2B | |
| $2.6B | |
| $4.0B | |
| $45.8B | |
| $70.3B | |
| $82.3B | |
| $22.0B | |
| $15.0B | |
| $13.2B | |
| $406.3B | |
| $6.2B | |
| $18.8B | |
| $17.8B | |
| $279.7M | |
| $10.4B | |
| $12.9B | |
| $1.4T | |
| $427.1M | |
| $14.4B | |
| $16.8B | |
| $6.1B | |
| $134.2B | |
| $17.9B | |
| $59.4B | |
| $12.6B | |
| $40.8B | |
| $991.1B | |
| $247.2B | |
| $15.7B | |
| $14.0B | |
| $477.4B | |
| $13.6B | |
| $579.3B | |
| $114.7B | |
| $376.5B | |
| $19.1B | |
| $76.5B | |
| $30.6B | |
| $41.7B | |
| $242.6B | |
| $404.3B | |
| $688.2B | |
| $251.9B | |
| $237.3B | |
| $301.3B | |
| $2.2T | |
| $13.3B | |
| $961.6M | |
| $2.1B | |
| $948.6M | |
| $832.4M | |
| $546.7M | |
| $1.1T | |
| $27.7B | |
| $63.5B | |
| $1.6B | |
| $4.0B | |
| $466.8B | |
| $115.5B | |
| $62.1B | |
| $1.6B | |
| $405.9B | |
| $1.6T | |
| $1.4T | |
| $74.4B | |
| $51.7B | |
| $3.6B | |
| $585.9B | |
| $807.7B | |
| $10.5B | |
| $75.7B | |
| $495.3B | |
| $3.2B | |
| $8.1B | |
| $27.9B | |
| $46.7B | |
| $906.0B | |
| $60.3M | |
| $45.6B | |
| $160.5B | |
| $507.5B | |
| $3.1T | |
| $25.5T | |
| $71.2B | |
| $80.4B | |
| $983.6M | |
| $408.8B | |
| $29.8B | |
| $20.7B |