Last updated May 19, 2025

| 1 | Iceland | 0.960 | |
| 2 | Germany | 0.957 | |
| 3 | Norway | 0.937 | |
| 4 | United Kingdom | 0.936 | |
| 5 | Denmark | 0.933 | |
| 6 | New Zealand | 0.930 | |
| 6 | Finland | 0.930 | |
| 8 | Switzerland | 0.924 | |
| 9 | Sweden | 0.923 | |
| 9 | Australia | 0.923 | |
| 11 | Netherlands | 0.920 | |
| 12 | Belgium | 0.917 | |
| 13 | Slovenia | 0.913 | |
| 14 | Palau | 0.911 | |
| 15 | United States | 0.909 | |
| 16 | Canada | 0.908 | |
| 17 | Lithuania | 0.906 | |
| 18 | Latvia | 0.904 | |
| 18 | United Arab Emirates | 0.904 | |
| 18 | Hong Kong | 0.904 | |
| 21 | Estonia | 0.892 | |
| 22 | Ireland | 0.890 | |
| 23 | Georgia | 0.887 | |
| 24 | Czech Republic | 0.883 | |
| 25 | Marshall Islands | 0.882 | |
| 25 | Poland | 0.882 | |
| 27 | Greece | 0.880 | |
| 28 | South Korea | 0.878 | |
| 29 | Argentina | 0.870 | |
| 30 | Singapore | 0.866 | |
| 30 | Austria | 0.866 | |
| 32 | Cyprus | 0.863 | |
| 32 | Israel | 0.863 | |
| 34 | Saint Kitts and Nevis | 0.860 | |
| 35 | Japan | 0.854 | |
| 36 | Russia | 0.849 | |
| 37 | Malta | 0.848 | |
| 37 | Spain | 0.848 | |
| 39 | Liechtenstein | 0.844 | |
| 40 | Croatia | 0.843 | |
| 41 | Slovakia | 0.842 | |
| 42 | Montenegro | 0.839 | |
| 43 | Chile | 0.837 | |
| 44 | France | 0.834 | |
| 45 | Luxembourg | 0.828 | |
| 46 | Hungary | 0.826 | |
| 47 | Kazakhstan | 0.824 | |
| 48 | Italy | 0.821 | |
| 49 | Bahrain | 0.819 | |
| 49 | Saint Vincent and the Grenadines | 0.819 | |
| 51 | Tonga | 0.816 | |
| 52 | Moldova | 0.807 | |
| 53 | Saudi Arabia | 0.799 | |
| 54 | Belarus | 0.796 | |
| 55 | Turkey | 0.793 | |
| 56 | Grenada | 0.791 | |
| 57 | Barbados | 0.788 | |
| 58 | Portugal | 0.787 | |
| 58 | Uruguay | 0.787 | |
| 60 | Serbia | 0.786 | |
| 61 | South Africa | 0.784 | |
| 62 | Romania | 0.783 | |
| 63 | Trinidad and Tobago | 0.782 | |
| 64 | Antigua and Barbuda | 0.781 | |
| 65 | Armenia | 0.777 | |
| 66 | Bulgaria | 0.766 | |
| 67 | Kyrgyzstan | 0.761 | |
| 68 | Seychelles | 0.759 | |
| 69 | Oman | 0.758 | |
| 70 | Bahamas | 0.754 | |
| 71 | Cuba | 0.753 | |
| 72 | Sri Lanka | 0.751 | |
| 73 | Iran | 0.748 | |
| 74 | Peru | 0.744 | |
| 75 | Bolivia | 0.743 | |
| 76 | Andorra | 0.742 | |
| 77 | Costa Rica | 0.741 | |
| 78 | Albania | 0.739 | |
| 78 | Mauritius | 0.739 | |
| 78 | Ukraine | 0.739 | |
| 81 | Turkmenistan | 0.737 | |
| 82 | Fiji | 0.730 | |
| 82 | Uzbekistan | 0.730 | |
| 84 | Thailand | 0.727 | |
| 85 | Samoa | 0.724 | |
| 86 | Panama | 0.723 | |
| 87 | Bosnia and Herzegovina | 0.719 | |
| 88 | Mongolia | 0.716 | |
| 89 | Malaysia | 0.715 | |
| 90 | Ecuador | 0.714 | |
| 91 | Brazil | 0.710 | |
| 92 | Mexico | 0.709 | |
| 93 | Azerbaijan | 0.706 | |
| 93 | Qatar | 0.706 | |
| 95 | North Macedonia | 0.701 | |
| 96 | Colombia | 0.697 | |
| 96 | Palestine | 0.697 | |
| 96 | Jordan | 0.697 | |
| 99 | Venezuela | 0.695 | |
| 100 | San Marino | 0.694 | |
| 101 | China | 0.692 | |
| 102 | Tuvalu | 0.689 | |
| 103 | Brunei | 0.687 | |
| 104 | Egypt | 0.685 | |
| 105 | Dominican Republic | 0.684 | |
| 105 | Dominica | 0.684 | |
| 107 | Kuwait | 0.683 | |
| 107 | Paraguay | 0.683 | |
| 109 | Tajikistan | 0.679 | |
| 110 | Indonesia | 0.676 | |
| 111 | Tunisia | 0.672 | |
| 112 | Gabon | 0.664 | |
| 112 | Algeria | 0.664 | |
| 114 | Botswana | 0.663 | |
| 115 | Nauru | 0.657 | |
| 116 | Philippines | 0.656 | |
| 117 | Jamaica | 0.654 | |
| 118 | Libya | 0.649 | |
| 119 | Guyana | 0.648 | |
| 120 | Vietnam | 0.647 | |
| 121 | Saint Lucia | 0.639 | |
| 122 | Belize | 0.638 | |
| 123 | Kiribati | 0.631 | |
| 124 | Lebanon | 0.623 | |
| 125 | Republic of the Congo | 0.621 | |
| 126 | Equatorial Guinea | 0.613 | |
| 127 | Morocco | 0.609 | |
| 128 | Eswatini | 0.604 | |
| 129 | Maldives | 0.599 | |
| 129 | Zimbabwe | 0.599 | |
| 131 | Nicaragua | 0.593 | |
| 131 | Micronesia | 0.593 | |
| 133 | Cameroon | 0.589 | |
| 134 | Suriname | 0.586 | |
| 135 | Bangladesh | 0.577 | |
| 136 | Kenya | 0.573 | |
| 137 | El Salvador | 0.571 | |
| 138 | India | 0.570 | |
| 139 | Vanuatu | 0.568 | |
| 139 | Comoros | 0.568 | |
| 139 | Namibia | 0.568 | |
| 142 | Timor Leste | 0.567 | |
| 143 | Iraq | 0.566 | |
| 144 | Lesotho | 0.558 | |
| 145 | Bhutan | 0.557 | |
| 146 | Myanmar | 0.553 | |
| 147 | Zambia | 0.549 | |
| 147 | Sao Tome and Principe | 0.549 | |
| 149 | Togo | 0.548 | |
| 150 | Nigeria | 0.545 | |
| 151 | Ghana | 0.536 | |
| 152 | Angola | 0.532 | |
| 153 | Uganda | 0.526 | |
| 154 | Cape Verde | 0.523 | |
| 155 | Honduras | 0.521 | |
| 156 | DR Congo | 0.507 | |
| 157 | Nepal | 0.500 | |
| 158 | Cambodia | 0.496 | |
| 159 | Haiti | 0.495 | |
| 160 | Malawi | 0.493 | |
| 161 | Guatemala | 0.490 | |
| 162 | Solomon Islands | 0.483 | |
| 163 | Laos | 0.480 | |
| 163 | Rwanda | 0.480 | |
| 165 | Papua New Guinea | 0.472 | |
| 166 | Liberia | 0.468 | |
| 167 | Mozambique | 0.427 | |
| 168 | Tanzania | 0.426 | |
| 169 | Ivory Coast | 0.421 | |
| 170 | Guinea Bissau | 0.415 | |
| 171 | Madagascar | 0.409 | |
| 172 | Gambia | 0.400 | |
| 173 | Syria | 0.396 | |
| 174 | Benin | 0.389 | |
| 175 | Burundi | 0.388 | |
| 176 | Mauritania | 0.385 | |
| 177 | Afghanistan | 0.381 | |
| 178 | Eritrea | 0.373 | |
| 179 | Sierra Leone | 0.367 | |
| 180 | Pakistan | 0.366 | |
| 180 | Sudan | 0.366 | |
| 182 | Guinea | 0.363 | |
| 183 | Ethiopia | 0.355 | |
| 184 | Djibouti | 0.352 | |
| 185 | Senegal | 0.349 | |
| 186 | South Sudan | 0.346 | |
| 187 | Central African Republic | 0.336 | |
| 188 | Yemen | 0.313 | |
| 189 | Chad | 0.304 | |
| 190 | Burkina Faso | 0.302 | |
| 191 | Somalia | 0.274 | |
| 192 | Mali | 0.248 | |
| 193 | Niger | 0.243 |
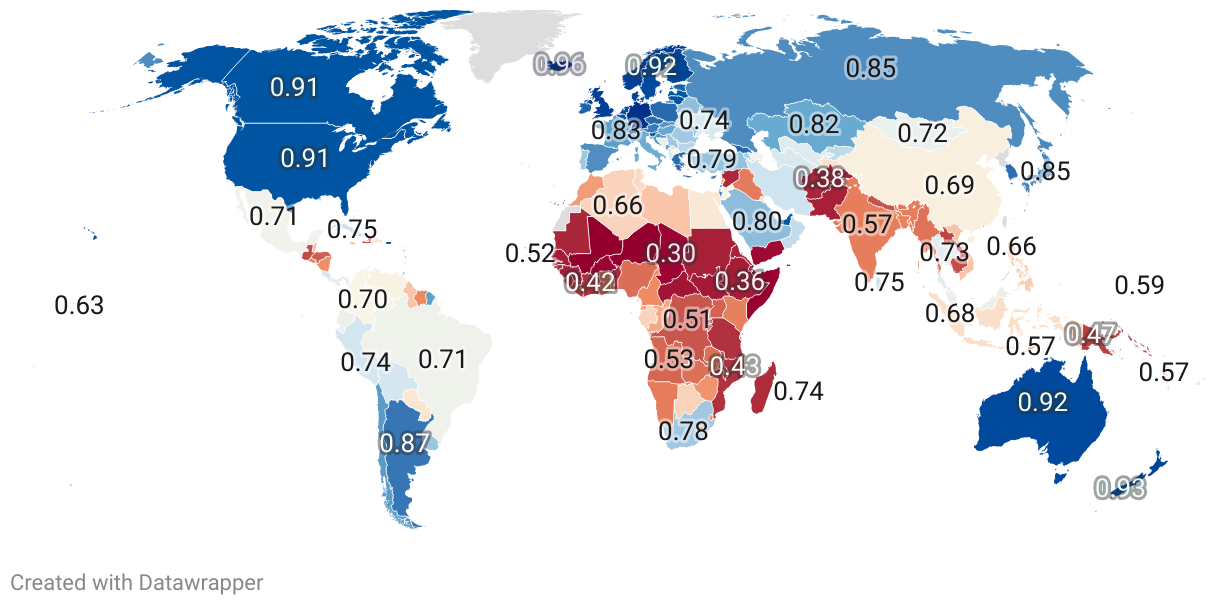
A strong education system is a cornerstone of economic prosperity and social progress, making national education rankings a critical indicator of a country’s global competitiveness. For this ranking, we use data from the 2023-2024 United Nations Human Development Report–specifically its Education Index–to provide an overview of academic performance around the world.
The Education Index is a key indicator published by the United Nations Development Program (UNDP) as part of its broader Human Development Index (HDI). It ranks countries based on education attainment, using two equally weighted factors: average years of schooling among adults (representing current educational achievement) and expected years of schooling for current students (representing future potential).
How to interpret the index:
Scores range from 0 (lowest) to 1 (highest) and indicate the quality of the country’s education system.
Countries with higher Education Index scores are better positioned to leverage their human capital to drive sustainable economic growth, foster innovation, and promote social stability for years to come.
| Region ↕ | Education Index 2022↕ | Inequality-adjusted Education Index 2023↕ | Years of Schooling 2023↕ |
|---|---|---|---|
| Iceland | 0.960 | 0.942 | 13.9 |
| Germany | 0.957 | 0.922 | 14.3 |
| Norway | 0.937 | 0.921 | 13.1 |
| United Kingdom | 0.936 | 0.915 | 13.5 |
| Denmark | 0.933 | 0.913 | 13 |
| New Zealand | 0.930 | 0.892 | 12.9 |
| Finland | 0.930 | 0.914 | 13 |
| Switzerland | 0.924 | 0.912 | 13.9 |
| Sweden | 0.923 | 0.901 | 12.7 |
| Australia | 0.923 | 0.889 | 12.9 |
| Netherlands | 0.920 | 0.879 | 12.7 |
| Belgium | 0.917 | 0.886 | 12.7 |
| Slovenia | 0.913 | 0.899 | 13 |
| Palau | 0.911 | 0.786 | 13.3 |
| United States | 0.909 | 0.882 | 13.9 |
| Canada | 0.908 | 0.884 | 13.9 |
| Lithuania | 0.906 | 0.893 | 13.6 |
| Latvia | 0.904 | 0.889 | 13.4 |
| United Arab Emirates | 0.904 | 0.786 | 13 |
| Hong Kong | 0.904 | 0.805 | 12.4 |
| Estonia | 0.892 | 0.881 | 13.6 |
| Ireland | 0.890 | 0.868 | 11.7 |
| Georgia | 0.887 | 0.867 | 12.7 |
| Czech Republic | 0.883 | 0.888 | 13 |
| Marshall Islands | 0.882 | 0.809 | 11.6 |
| Poland | 0.882 | 0.861 | 13.2 |
| Greece | 0.880 | 0.826 | 11.6 |
| South Korea | 0.878 | 0.831 | 12.7 |
| Argentina | 0.870 | 0.83 | 11.2 |
| Singapore | 0.866 | 0.79 | 12 |
| Austria | 0.866 | 0.842 | 12.4 |
| Cyprus | 0.863 | 0.822 | 12.6 |
| Israel | 0.863 | 0.82 | 13.5 |
| Saint Kitts and Nevis | 0.860 | 10.8 | |
| Japan | 0.854 | 0.805 | 12.7 |
| Russia | 0.849 | 0.768 | 12.4 |
| Malta | 0.848 | 0.812 | 12.4 |
| Spain | 0.848 | 0.772 | 10.8 |
| Liechtenstein | 0.844 | 12.4 | |
| Croatia | 0.843 | 0.832 | 12.1 |
| Slovakia | 0.842 | 0.839 | 13.1 |
| Montenegro | 0.839 | 0.79 | 12.8 |
| Chile | 0.837 | 0.795 | 11.3 |
| France | 0.834 | 0.795 | 11.8 |
| Luxembourg | 0.828 | 0.774 | 12.6 |
| Hungary | 0.826 | 0.819 | 12.3 |
| Kazakhstan | 0.824 | 0.782 | 12.5 |
| Italy | 0.821 | 0.763 | 10.8 |
| Bahrain | 0.819 | 0.706 | 11.1 |
| Saint Vincent and the Grenadines | 0.819 | 0.778 | 11.3 |
| Tonga | 0.816 | 0.821 | 10.9 |
| Moldova | 0.807 | 0.783 | 11.8 |
| Saudi Arabia | 0.799 | 0.748 | 11.6 |
| Belarus | 0.796 | 0.77 | 12.3 |
| Turkey | 0.793 | 0.7 | 9 |
| Grenada | 0.791 | 0.721 | 9.4 |
| Barbados | 0.788 | 0.749 | 9.9 |
| Portugal | 0.787 | 0.73 | 9.7 |
| Uruguay | 0.787 | 0.773 | 10.5 |
| Serbia | 0.786 | 0.773 | 11.6 |
| South Africa | 0.784 | 0.637 | 11.6 |
| Romania | 0.783 | 0.746 | 11.6 |
| Trinidad and Tobago | 0.782 | 0.711 | 10.8 |
| Antigua and Barbuda | 0.781 | 0.738 | 11.6 |
| Armenia | 0.777 | 0.755 | 11.3 |
| Bulgaria | 0.766 | 0.772 | 11.5 |
| Kyrgyzstan | 0.761 | 0.73 | 12.1 |
| Seychelles | 0.759 | 0.815 | 11.2 |
| Oman | 0.758 | 0.72 | 11.9 |
| Bahamas | 0.754 | 0.732 | 12.8 |
| Cuba | 0.753 | 0.673 | 10.6 |
| Sri Lanka | 0.751 | 0.642 | 10.8 |
| Iran | 0.748 | 0.586 | 10.8 |
| Peru | 0.744 | 0.608 | 10.2 |
| Bolivia | 0.743 | 0.652 | 10 |
| Andorra | 0.742 | 0.747 | 11.6 |
| Costa Rica | 0.741 | 0.667 | 8.8 |
| Albania | 0.739 | 0.651 | 10.2 |
| Mauritius | 0.739 | 0.676 | 10.1 |
| Ukraine | 0.739 | 0.714 | 11.1 |
| Turkmenistan | 0.737 | 0.72 | 11.2 |
| Fiji | 0.730 | 0.667 | 10.4 |
| Uzbekistan | 0.730 | 0.73 | 11.9 |
| Thailand | 0.727 | 0.612 | 9 |
| Samoa | 0.724 | 0.672 | 11.3 |
| Panama | 0.723 | 0.659 | 10.8 |
| Bosnia and Herzegovina | 0.719 | 0.657 | 11 |
| Mongolia | 0.716 | 0.61 | 9.4 |
| Malaysia | 0.715 | 0.657 | 11.1 |
| Ecuador | 0.714 | 0.625 | 9 |
| Brazil | 0.710 | 0.611 | 8.4 |
| Mexico | 0.709 | 0.6 | 9.3 |
| Azerbaijan | 0.706 | 0.696 | 11.1 |
| Qatar | 0.706 | 0.651 | 10.8 |
| North Macedonia | 0.701 | 0.689 | 10.2 |
| Colombia | 0.697 | 0.579 | 9 |
| Palestine | 0.697 | 0.632 | 10.1 |
| Jordan | 0.697 | 0.614 | 10.2 |
| Venezuela | 0.695 | 0.616 | 9.7 |
| San Marino | 0.694 | 0.752 | 11.4 |
| China | 0.692 | 0.626 | 8 |
| Tuvalu | 0.689 | 0.638 | 10.8 |
| Brunei | 0.687 | 0.62 | 9.3 |
| Egypt | 0.685 | 0.443 | 10.1 |
| Dominican Republic | 0.684 | 0.592 | 9.4 |
| Dominica | 0.684 | 0.612 | 10.1 |
| Kuwait | 0.683 | 0.541 | 7.6 |
| Paraguay | 0.683 | 0.585 | 8.9 |
| Tajikistan | 0.679 | 0.636 | 11.3 |
| Indonesia | 0.676 | 0.575 | 8.7 |
| Tunisia | 0.672 | 0.469 | 7.6 |
| Gabon | 0.664 | 0.531 | 9.7 |
| Algeria | 0.664 | 0.452 | 7.4 |
| Botswana | 0.663 | 0.511 | 10.5 |
| Nauru | 0.657 | 0.613 | 9.4 |
| Philippines | 0.656 | 0.606 | 10 |
| Jamaica | 0.654 | 0.637 | 10 |
| Libya | 0.649 | 7.8 | |
| Guyana | 0.648 | 0.584 | 8.7 |
| Vietnam | 0.647 | 0.618 | 9 |
| Saint Lucia | 0.639 | 0.401 | 8.6 |
| Belize | 0.638 | 0.532 | 8.8 |
| Kiribati | 0.631 | 0.573 | 9.1 |
| Lebanon | 0.623 | 10.4 | |
| Republic of the Congo | 0.621 | 0.498 | 8.3 |
| Equatorial Guinea | 0.613 | 8.3 | |
| Morocco | 0.609 | 0.364 | 6.2 |
| Eswatini | 0.604 | 0.564 | 8.7 |
| Maldives | 0.599 | 0.425 | 7.4 |
| Zimbabwe | 0.599 | 0.517 | 8.9 |
| Nicaragua | 0.593 | 0.483 | 9.9 |
| Micronesia | 0.593 | 7.3 | |
| Cameroon | 0.589 | 0.354 | 6.6 |
| Suriname | 0.586 | 0.478 | 8.4 |
| Bangladesh | 0.577 | 0.368 | 6.8 |
| Kenya | 0.573 | 0.487 | 8.6 |
| El Salvador | 0.571 | 0.435 | 7.3 |
| India | 0.570 | 0.372 | 6.9 |
| Vanuatu | 0.568 | 0.466 | 7.2 |
| Comoros | 0.568 | 0.317 | 6 |
| Namibia | 0.568 | 0.427 | 7.3 |
| Timor Leste | 0.567 | 0.317 | 6.2 |
| Iraq | 0.566 | 0.4 | 6.8 |
| Lesotho | 0.558 | 0.453 | 7.7 |
| Bhutan | 0.557 | 0.29 | 5.8 |
| Myanmar | 0.553 | 0.389 | 6.4 |
| Zambia | 0.549 | 0.44 | 7.4 |
| Sao Tome and Principe | 0.549 | 0.453 | 6 |
| Togo | 0.548 | 0.348 | 5.9 |
| Nigeria | 0.545 | 0.339 | 7.6 |
| Ghana | 0.536 | 0.371 | 7.1 |
| Angola | 0.532 | 0.353 | 6 |
| Uganda | 0.526 | 0.384 | 6.3 |
| Cape Verde | 0.523 | 0.377 | 6.1 |
| Honduras | 0.521 | 0.418 | 7.5 |
| DR Congo | 0.507 | 0.402 | 7.4 |
| Nepal | 0.500 | 0.32 | 4.5 |
| Cambodia | 0.496 | 0.348 | 5.2 |
| Haiti | 0.495 | 0.302 | 5.4 |
| Malawi | 0.493 | 0.324 | 5.2 |
| Guatemala | 0.490 | 0.32 | 5.8 |
| Solomon Islands | 0.483 | 0.422 | 5.9 |
| Laos | 0.480 | 0.322 | 6.1 |
| Rwanda | 0.480 | 0.372 | 4.9 |
| Papua New Guinea | 0.472 | 0.329 | 5 |
| Liberia | 0.468 | 0.287 | 6.2 |
| Mozambique | 0.427 | 0.298 | 4.6 |
| Tanzania | 0.426 | 0.325 | 6.1 |
| Ivory Coast | 0.421 | 0.258 | 4.9 |
| Guinea Bissau | 0.415 | 0.242 | 3.7 |
| Madagascar | 0.409 | 0.29 | 4.6 |
| Gambia | 0.400 | 0.215 | 4.7 |
| Syria | 0.396 | 5.9 | |
| Benin | 0.389 | 0.222 | 3.2 |
| Burundi | 0.388 | 0.235 | 3.5 |
| Mauritania | 0.385 | 0.214 | 4.9 |
| Afghanistan | 0.381 | 0.196 | 2.5 |
| Eritrea | 0.373 | 5.1 | |
| Sierra Leone | 0.367 | 0.194 | 3.5 |
| Pakistan | 0.366 | 0.205 | 4.3 |
| Sudan | 0.366 | 0.214 | 4 |
| Guinea | 0.363 | 0.185 | 2.5 |
| Ethiopia | 0.355 | 0.192 | 2.4 |
| Djibouti | 0.352 | 0.165 | 4 |
| Senegal | 0.349 | 0.186 | 2.9 |
| South Sudan | 0.346 | 0.21 | 5.7 |
| Central African Republic | 0.336 | 0.22 | 4 |
| Yemen | 0.313 | 0.209 | 5.5 |
| Chad | 0.304 | 0.177 | 2.3 |
| Burkina Faso | 0.302 | 0.172 | 2.3 |
| Somalia | 0.274 | 0.15 | 1.9 |
| Mali | 0.248 | 0.148 | 1.6 |
| Niger | 0.243 | 0.181 | 1.4 |
The best-ranked education systems share common foundations: substantial public investment, universal access among different socio-economic groups, rigorous teacher qualification standards, and data-based education policies. Nordic countries dominate the ranking, suggesting that their comprehensive approach to education produces exceptional results.
Iceland leads the world education ranking with a near-perfect score of 0.960, demonstrating an excellent balance between present and future educational metrics. Germany (0.957) ranks second, with the highest average years of schooling (14.3) of any country. Norway ranks third with 0.937, followed closely by the United Kingdom with 0.936. Denmark completes the top five with 0.933. Finland and New Zealand share sixth place (0.930). Switzerland ranks 8th (0.924), followed by Australia (0.923), which has the highest expected years of schooling in the world (21.1). Sweden completes the top ten with a score of 0.923, just 0.037 points below Iceland, highlighting the minimal difference between education leaders.