Maine
See More
15.3B
Ranked in U.S.
#14
Last updated September 18, 2024
| 1. | Arkansas | 31.9B | |
| 2. | Virginia | 173.8B | |
| 3. | Kentucky | 84.5B | |
| 4. | Alaska | 13.5B | |
| 5. | New Mexico | 33.4B | |
| 6. | Maryland | 88.0B | |
| 7. | Alabama | 69.0B | |
| 8. | West Virginia | 24.4B | |
| 9. | Mississippi | 40.2B | |
| 10. | Hawaii | 18.6B | |
| 11. | Louisiana | 59.0B | |
| 12. | Vermont | 7.3B | |
| 13. | Oklahoma | 44.8B | |
| 14. | Maine | 15.3B | |
| 15. | Arizona | 78.3B | |
| 16. | South Carolina | 55.6B | |
| 17. | Montana | 10.8B | |
| 18. | Tennessee | 67.2B | |
| 19. | North Dakota | 7.4B | |
| 20. | Missouri | 59.1B | |
| 21. | Pennsylvania | 122.2B | |
| 22. | Rhode Island | 10.2B | |
| 23. | Ohio | 108.2B | |
| 24. | Delaware | 9.1B | |
| 25. | Michigan | 89.1B | |
| 26. | South Dakota | 7.7B | |
| 27. | Georgia | 92.2B | |
| 28. | North Carolina | 90.3B | |
| 29. | Indiana | 56.9B | |
| 30. | Oregon | 32.9B | |
| 31. | Iowa | 24.4B | |
| 32. | Kansas | 22.2B | |
| 33. | Florida | 162.9B | |
| 34. | Nevada | 23.4B | |
| 35. | Illinois | 93.8B | |
| 36. | Idaho | 13.4B | |
| 37. | Wyoming | 4.0B | |
| 38. | Wisconsin | 39.3B | |
| 39. | Texas | 183.9B | |
| 40. | Nebraska | 11.9B | |
| 41. | New York | 115.2B | |
| 42. | Minnesota | 29.8B | |
| 43. | California | 201.8B | |
| 44. | Colorado | 26.8B | |
| 45. | New Jersey | 36.4B | |
| 46. | New Hampshire | 5.0B | |
| 47. | Massachusetts | 22.0B | |
| 48. | Washington | 24.0B | |
| 49. | Utah | 10.3B | |
| 50. | Connecticut | 3.3B |
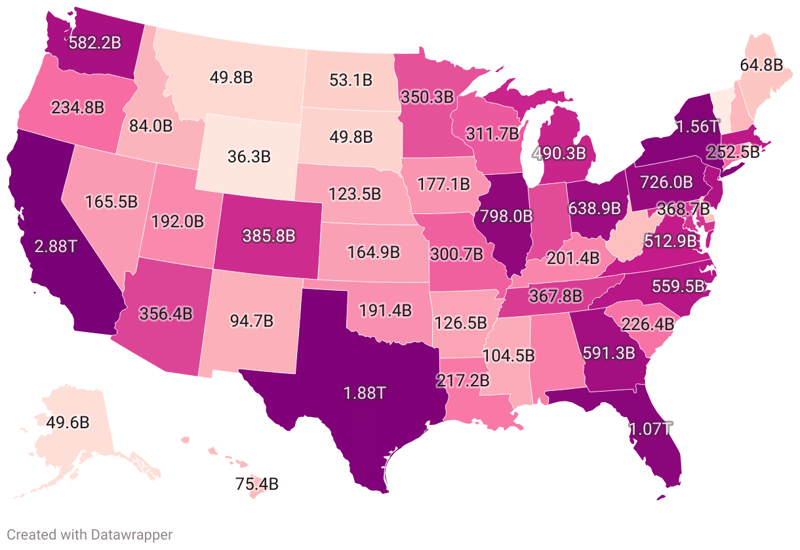
The distribution of Federal aid across states in the United States is a dynamic process, intertwined with various factors such as population size, poverty levels, tax revenues, and infrastructure needs. This aid plays a significant role in funding essential services and support programs like public education, Medicaid, transportation, and community development projects, affecting the lives of millions of American citizens. Federal aid, however, does not distribute evenly across the states. Information from the Federal Aid Payments database reveal key insights about the disparities in federal aid, distribution patterns, and influential factors driving these variations.
Leading the ranking is Virginia, which intriguingly receives substantial federal funding of $173.8B. Given its smaller population compared to some states, this largely stems from Virginia's high concentration of federal facilities and federal contractors within its borders. Second on the list is Maryland, with its federal aid amounting to $88.0B. Industry plays a significant role in Maryland's economy, with the state being home to many federal institutions, including the Social Security Administration and National Institutes of Health. Kentucky ranks third with a total aid of $84.5B, while Alabama, with federal aid of $69.0B, stands at seventh place. Both these states have relatively high levels of poverty, thereby initiating more federal assistance to support their local programs and welfare. The federal aid received by Arkansas and New Mexico, $31.9B and $33.4B respectively, places them both in the top ten of states receiving federal aid, despite their small populations. This indicates that these states have sizable needs that are met by federal intervention, which could be associated with lower state tax revenue and higher levels of poverty. Hawaii, with federal aid of $18.6B, Mississippi, with federal aid of $40.2B, and West Virginia, with federal aid of $24.4B, also mark their positions high on the list. These states illustrate an essential point: states with less affluent populations often rely more heavily on federal funds to support their local economies and public programs. Last is Alaska, which brings in $13.5B in federal aid. Despite its geographic size, Alaska possesses the nation's smallest population, which may be a contributing factor to its spot on the list. States that Receive the Most Federal Aid:
69.0B
Ranked in U.S.
#7
13.5B
Ranked in U.S.
#4
78.3B
Ranked in U.S.
#15
31.9B
Ranked in U.S.
#1
201.8B
Ranked in U.S.
#43
26.8B
Ranked in U.S.
#44
Ranked in U.S.
#50
Ranked in U.S.
#24
162.9B
Ranked in U.S.
#33
92.2B
Ranked in U.S.
#27
18.6B
Ranked in U.S.
#10
13.4B
Ranked in U.S.
#36
93.8B
Ranked in U.S.
#35
56.9B
Ranked in U.S.
#29
24.4B
Ranked in U.S.
#31
22.2B
Ranked in U.S.
#32
84.5B
Ranked in U.S.
#3
59.0B
Ranked in U.S.
#11
15.3B
Ranked in U.S.
#14
88.0B
Ranked in U.S.
#6
22.0B
Ranked in U.S.
#47
89.1B
Ranked in U.S.
#25
29.8B
Ranked in U.S.
#42
40.2B
Ranked in U.S.
#9
59.1B
Ranked in U.S.
#20
10.8B
Ranked in U.S.
#17
11.9B
Ranked in U.S.
#40
23.4B
Ranked in U.S.
#34
Ranked in U.S.
#46
36.4B
Ranked in U.S.
#45
33.4B
Ranked in U.S.
#5
115.2B
Ranked in U.S.
#41
90.3B
Ranked in U.S.
#28
Ranked in U.S.
#19
108.2B
Ranked in U.S.
#23
44.8B
Ranked in U.S.
#13
32.9B
Ranked in U.S.
#30
122.2B
Ranked in U.S.
#21
10.2B
Ranked in U.S.
#22
55.6B
Ranked in U.S.
#16
Ranked in U.S.
#26
67.2B
Ranked in U.S.
#18
183.9B
Ranked in U.S.
#39
10.3B
Ranked in U.S.
#49
Ranked in U.S.
#12
173.8B
Ranked in U.S.
#2
24.0B
Ranked in U.S.
#48
24.4B
Ranked in U.S.
#8
39.3B
Ranked in U.S.
#38
Ranked in U.S.
#37
| Region ↕ | Federal Aid Payments↕ |
|---|---|
| 69.0B | |
| 13.5B | |
| 78.3B | |
| 31.9B | |
| 201.8B | |
| 26.8B | |
| 3.3B | |
| 9.1B | |
| 162.9B | |
| 92.2B | |
| 18.6B | |
| 13.4B | |
| 93.8B | |
| 56.9B | |
| 24.4B | |
| 22.2B | |
| 84.5B | |
| 59.0B | |
| 15.3B | |
| 88.0B | |
| 22.0B | |
| 89.1B | |
| 29.8B | |
| 40.2B | |
| 59.1B | |
| 10.8B | |
| 11.9B | |
| 23.4B | |
| 5.0B | |
| 36.4B | |
| 33.4B | |
| 115.2B | |
| 90.3B | |
| 7.4B | |
| 108.2B | |
| 44.8B | |
| 32.9B | |
| 122.2B | |
| 10.2B | |
| 55.6B | |
| 7.7B | |
| 67.2B | |
| 183.9B | |
| 10.3B | |
| 7.3B | |
| 173.8B | |
| 24.0B | |
| 24.4B | |
| 39.3B | |
| 4.0B |