Maine
See More
Ranked in U.S.
#7
Last updated November 17, 2024
| 1. | California | 26.5 | |
| 2. | Massachusetts | 26.5 | |
| 3. | Connecticut | 26.3 | |
| 4. | New Hampshire | 25.7 | |
| 5. | New York | 25.3 | |
| 6. | Rhode Island | 25.2 | |
| 7. | Maine | 25.1 | |
| 8. | Delaware | 24.9 | |
| 9. | Michigan | 24.6 | |
| 10. | New Jersey | 24.6 | |
| 11. | Virginia | 24.6 | |
| 12. | Washington | 24.6 | |
| 13. | Illinois | 24.5 | |
| 14. | Maryland | 24.4 | |
| 15. | Pennsylvania | 24.4 | |
| 16. | Vermont | 23.7 | |
| 17. | Colorado | 23.2 | |
| 18. | Oregon | 23.0 | |
| 19. | Idaho | 22.8 | |
| 20. | Indiana | 22.8 | |
| 21. | Georgia | 21.6 | |
| 22. | South Dakota | 21.5 | |
| 23. | Iowa | 21.4 | |
| 24. | Minnesota | 21.0 | |
| 25. | West Virginia | 20.5 | |
| 26. | Alaska | 20.4 | |
| 27. | Missouri | 20.2 | |
| 28. | Kansas | 19.9 | |
| 29. | Utah | 19.9 | |
| 30. | New Mexico | 19.8 | |
| 31. | Texas | 19.8 | |
| 32. | Nebraska | 19.4 | |
| 33. | Ohio | 19.4 | |
| 34. | Wisconsin | 19.4 | |
| 35. | Montana | 19.3 | |
| 36. | North Dakota | 19.2 | |
| 37. | Wyoming | 19.2 | |
| 38. | Florida | 19.0 | |
| 39. | South Carolina | 18.9 | |
| 40. | Arkansas | 18.8 | |
| 41. | Hawaii | 18.8 | |
| 42. | Kentucky | 18.6 | |
| 43. | Tennessee | 18.6 | |
| 44. | North Carolina | 18.5 | |
| 45. | Arizona | 18.4 | |
| 46. | Louisiana | 18.1 | |
| 47. | Alabama | 18.0 | |
| 48. | Oklahoma | 17.9 | |
| 49. | Mississippi | 17.8 | |
| 50. | Nevada | 17.3 |
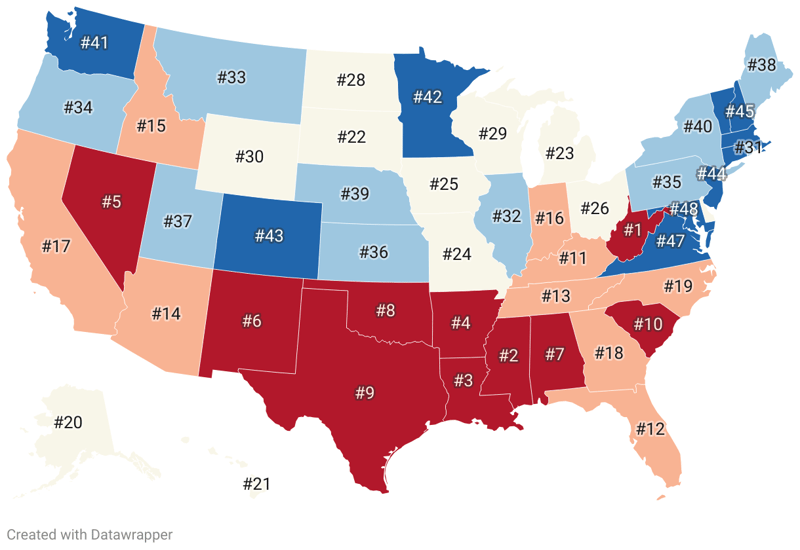
The ACT, or the American College Testing exam, is a standardized exam that high school students across the United States take part in, aimed at showcasing their academic knowledge and readiness for college. The test, divided into four key academic areas - English, Mathematics, Reading, and Science, is a gateway to college admissions, and its scores play a pivotal role in shaping the future of millions of students each year. The ACT score, ranging from 1 to 36, is a cumulative average of the scores secured in each subject area, with an average national score — the benchmark score — set at 20.6. In the 2019/2020 academic year, around 1.67 million students took the ACT with an aim of achieving the best possible score, befitting their collegiate aspirations. Through an investigation into the public data of average ACT scores by state, we present you with some distinctive key findings:
California and Massachusetts have the highest ACT scores in the country, both with an ACT score of 26.5. Trailing closely behind is Connecticut, with a promising average ACT score of 26.3. The fourth in line is New Hampshire, which has recorded an average ACT score of 25.7. The fifth state with the highest average ACT score is New York, not far behind, with an average score of 25.3. Rhode Island follows closely with an average ACT score of 25.2. Additionally, both Maine and Delaware have students showcasing scholastic talents with an average ACT score of 25.1 and 24.9, respectively. Rounding out the top ten states with the highest ACT scores is New Jersey, with an average score of 24.6. These states, with their above-average ACT scores, undeniably signal a commitment to educational excellence and college readiness. States with Highest ACT Scores:
Nevada records the lowest average ACT score, standing at 17.3. In the 49th place, Mississippi has an average ACT score of 17.8, closely followed by Oklahoma with a score of 17.9. In Alabama, the average ACT score is 18.0, which is still below the national average. Similarly, Louisiana with an average score of 18.1, Arizona with 18.4, North Carolina with 18.5, and Kentucky and Tennessee, which both have an average ACT score of 18.6, all fall short of reaching the average national benchmark score. Last, on this list, Arkansas stands with an average ACT score of 18.8. States with the Lowest ACT Scores:
Ranked in U.S.
#47
Ranked in U.S.
#26
Ranked in U.S.
#45
Ranked in U.S.
#40
Ranked in U.S.
#1
Ranked in U.S.
#17
Ranked in U.S.
#3
Ranked in U.S.
#8
Ranked in U.S.
#38
Ranked in U.S.
#21
Ranked in U.S.
#41
Ranked in U.S.
#19
Ranked in U.S.
#13
Ranked in U.S.
#20
Ranked in U.S.
#23
Ranked in U.S.
#28
Ranked in U.S.
#42
Ranked in U.S.
#46
Ranked in U.S.
#7
Ranked in U.S.
#14
Ranked in U.S.
#2
Ranked in U.S.
#9
Ranked in U.S.
#24
Ranked in U.S.
#49
Ranked in U.S.
#27
Ranked in U.S.
#35
Ranked in U.S.
#32
Ranked in U.S.
#50
Ranked in U.S.
#4
Ranked in U.S.
#10
Ranked in U.S.
#30
Ranked in U.S.
#5
Ranked in U.S.
#44
Ranked in U.S.
#36
Ranked in U.S.
#33
Ranked in U.S.
#48
Ranked in U.S.
#18
Ranked in U.S.
#15
Ranked in U.S.
#6
Ranked in U.S.
#39
Ranked in U.S.
#22
Ranked in U.S.
#43
Ranked in U.S.
#31
Ranked in U.S.
#29
Ranked in U.S.
#16
Ranked in U.S.
#11
Ranked in U.S.
#12
Ranked in U.S.
#25
Ranked in U.S.
#34
Ranked in U.S.
#37
| Region ↕ | Average ACT Score↕ |
|---|---|
| 18.0 | |
| 20.4 | |
| 18.4 | |
| 18.8 | |
| 26.5 | |
| 23.2 | |
| 26.3 | |
| 24.9 | |
| 19.0 | |
| 21.6 | |
| 18.8 | |
| 22.8 | |
| 24.5 | |
| 22.8 | |
| 21.4 | |
| 19.9 | |
| 18.6 | |
| 18.1 | |
| 25.1 | |
| 24.4 | |
| 26.5 | |
| 24.6 | |
| 21.0 | |
| 17.8 | |
| 20.2 | |
| 19.3 | |
| 19.4 | |
| 17.3 | |
| 25.7 | |
| 24.6 | |
| 19.8 | |
| 25.3 | |
| 18.5 | |
| 19.2 | |
| 19.4 | |
| 17.9 | |
| 23.0 | |
| 24.4 | |
| 25.2 | |
| 18.9 | |
| 21.5 | |
| 18.6 | |
| 19.8 | |
| 19.9 | |
| 23.7 | |
| 24.6 | |
| 24.6 | |
| 20.5 | |
| 19.4 | |
| 19.2 |