Maine
See More
55.8
Ranked in U.S.
#38
Ranked in U.S.
#6
College Enrollment Per Capita
5,089
Last updated November 24, 2024

| 1. | West Virginia | 12.6 | |
| 2. | Mississippi | 13.3 | |
| 3. | Louisiana | 15.2 | |
| 4. | Arkansas | 19.1 | |
| 5. | Nevada | 20.0 | |
| 6. | New Mexico | 20.4 | |
| 7. | Alabama | 22.4 | |
| 8. | Oklahoma | 22.4 | |
| 9. | Texas | 23.9 | |
| 10. | South Carolina | 28.0 | |
| 11. | Kentucky | 30.5 | |
| 12. | Florida | 32.4 | |
| 13. | Tennessee | 34.2 | |
| 14. | Arizona | 35.9 | |
| 15. | Idaho | 36.8 | |
| 16. | Indiana | 36.8 | |
| 17. | California | 40.0 | |
| 18. | Georgia | 40.2 | |
| 19. | North Carolina | 40.7 | |
| 20. | Alaska | 43.1 | |
| 21. | Hawaii | 43.1 | |
| 22. | South Dakota | 43.1 | |
| 23. | Michigan | 43.8 | |
| 24. | Missouri | 45.0 | |
| 25. | Iowa | 46.2 | |
| 26. | Ohio | 46.7 | |
| 27. | Delaware | 46.8 | |
| 28. | North Dakota | 48.4 | |
| 29. | Wisconsin | 48.5 | |
| 30. | Wyoming | 49.3 | |
| 31. | Rhode Island | 50.5 | |
| 32. | Illinois | 51.4 | |
| 33. | Montana | 51.9 | |
| 34. | Oregon | 52.0 | |
| 35. | Pennsylvania | 52.4 | |
| 36. | Kansas | 55.5 | |
| 37. | Utah | 55.5 | |
| 38. | Maine | 55.8 | |
| 39. | Nebraska | 57.8 | |
| 40. | New York | 57.8 | |
| 41. | Washington | 60.3 | |
| 42. | Minnesota | 67.0 | |
| 43. | Colorado | 69.4 | |
| 44. | New Jersey | 69.5 | |
| 45. | New Hampshire | 70.5 | |
| 46. | Vermont | 72.2 | |
| 47. | Virginia | 72.5 | |
| 48. | Maryland | 72.8 | |
| 49. | Connecticut | 73.8 | |
| 50. | Massachusetts | 93.9 |
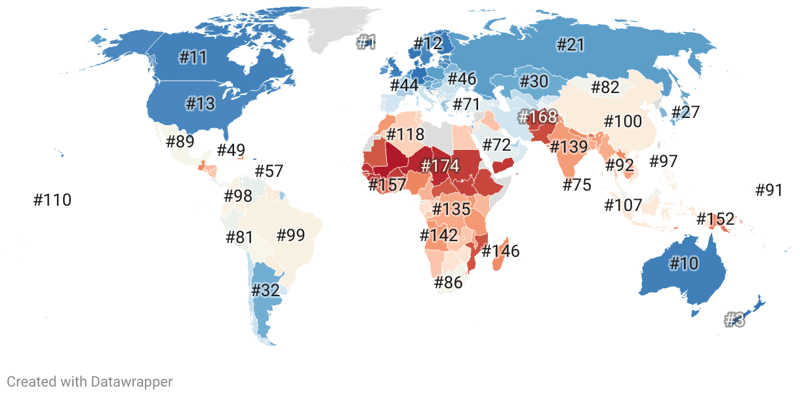
Assessing a state's intelligence is an intricate task considering the numerous factors that contribute to education and smartness. While some states demonstrate a high level of intelligence due to favorable circumstances, others significantly lag behind due to various underlying issues. A significant role is attributed to the state's GDP, access to quality education, family income, educational standards, and even societal attitudes towards learning.
By taking a closer look at the data collected by 'Penn Stakes', we assess each state based on IQ scores, SAT scores, ACT scores, and the percentage of college graduates, crucial factors that provide a snapshot of the intelligence levels.
| Region ↕ | Penn Stakes↕ | High School Completion Rate↕ | College Enrollment Per Capita 2020↕ |
|---|---|---|---|
| 22.4 | 86.9% | 5,797 | |
| 43.1 | 93.1% | 3,017 | |
| 35.9 | 87.9% | 8,247 | |
| 19.1 | 87.2% | 4,934 | |
| 40.0 | 83.9% | 6,575 | |
| 69.4 | 92.1% | 6,233 | |
| 73.8 | 90.9% | 5,179 | |
| 46.8 | 90.6% | 5,848 | |
| 32.4 | 88.5% | 4,717 | |
| 40.2 | 87.9% | 5,069 | |
| 43.1 | 92.5% | 4,141 | |
| 36.8 | 91.3% | 6,470 | |
| 51.4 | 89.7% | 5,382 | |
| 36.8 | 89.3% | 6,038 | |
| 46.2 | 92.5% | 6,521 | |
| 55.5 | 91.4% | 6,581 | |
| 30.5 | 87.2% | 5,797 | |
| 15.2 | 85.9% | 5,266 | |
| 55.8 | 93.2% | 5,089 | |
| 72.8 | 90.6% | 5,646 | |
| 93.9 | 91.1% | 6,782 | |
| 43.8 | 91.3% | 4,876 | |
| 67.0 | 93.4% | 6,933 | |
| 13.3 | 85.3% | 5,527 | |
| 45.0 | 90.6% | 5,555 | |
| 51.9 | 94.0% | 4,117 | |
| 57.8 | 91.6% | 6,876 | |
| 20.0 | 86.9% | 3,711 | |
| 70.5 | 93.3% | 13,574 | |
| 69.5 | 90.3% | 4,234 | |
| 20.4 | 86.5% | 5,203 | |
| 57.8 | 87.2% | 5,961 | |
| 40.7 | 88.5% | 5,285 | |
| 48.4 | 93.1% | 6,621 | |
| 46.7 | 90.8% | 5,556 | |
| 22.4 | 88.6% | 4,746 | |
| 52.0 | 91.1% | 4,799 | |
| 52.4 | 91.0% | 5,149 | |
| 50.5 | 89.2% | 7,036 | |
| 28.0 | 88.3% | 4,527 | |
| 43.1 | 92.2% | 5,679 | |
| 34.2 | 88.2% | 4,534 | |
| 23.9 | 84.4% | 5,423 | |
| 55.5 | 93.0% | 11,851 | |
| 72.2 | 93.5% | 6,141 | |
| 72.5 | 90.3% | 6,431 | |
| 60.3 | 91.7% | 4,317 | |
| 12.6 | 87.6% | 7,725 | |
| 48.5 | 92.6% | 5,408 | |
| 49.3 | 93.6% | 5,346 |
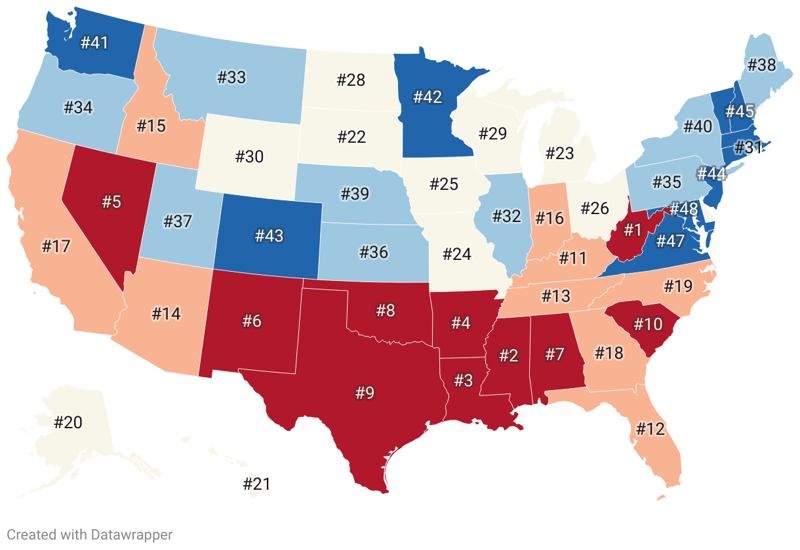
Falling at the bottom place is West Virginia, with an intelligence index of 12.6, followed by Mississippi at 13.3. Louisiana, with an intelligence index of 15.2, takes the third rank from the bottom.
Arkansas and Nevada follow suit, with indexes being 19.1 and 20.0, respectively. The southwestern state of New Mexico ranks sixth from the bottom, with an index of 20.4. Alabama and Oklahoma have comparable indexes at 22.4. Texas, with its large and diverse population, has an index of 23.9. Finally, South Carolina lands a spot in the ten 'dumbest' states with an index of 28.0.
10 Dumbest States:
22.4
Ranked in U.S.
#7
Ranked in U.S.
#44
College Enrollment Per Capita
5,797
43.1
Ranked in U.S.
#20
Ranked in U.S.
#7
College Enrollment Per Capita
3,017
35.9
Ranked in U.S.
#14
Ranked in U.S.
#38
College Enrollment Per Capita
8,247
19.1
Ranked in U.S.
#4
Ranked in U.S.
#41
College Enrollment Per Capita
4,934
40.0
Ranked in U.S.
#17
Ranked in U.S.
#50
College Enrollment Per Capita
6,575
69.4
Ranked in U.S.
#43
Ranked in U.S.
#14
College Enrollment Per Capita
6,233
73.8
Ranked in U.S.
#49
Ranked in U.S.
#23
College Enrollment Per Capita
5,179
46.8
Ranked in U.S.
#27
Ranked in U.S.
#25
College Enrollment Per Capita
5,848
32.4
Ranked in U.S.
#12
Ranked in U.S.
#34
College Enrollment Per Capita
4,717
40.2
Ranked in U.S.
#18
Ranked in U.S.
#39
College Enrollment Per Capita
5,069
43.1
Ranked in U.S.
#21
Ranked in U.S.
#11
College Enrollment Per Capita
4,141
36.8
Ranked in U.S.
#15
Ranked in U.S.
#18
College Enrollment Per Capita
6,470
51.4
Ranked in U.S.
#32
Ranked in U.S.
#30
College Enrollment Per Capita
5,382
36.8
Ranked in U.S.
#16
Ranked in U.S.
#31
College Enrollment Per Capita
6,038
46.2
Ranked in U.S.
#25
Ranked in U.S.
#12
College Enrollment Per Capita
6,521
55.5
Ranked in U.S.
#36
Ranked in U.S.
#17
College Enrollment Per Capita
6,581
30.5
Ranked in U.S.
#11
Ranked in U.S.
#42
College Enrollment Per Capita
5,797
15.2
Ranked in U.S.
#3
Ranked in U.S.
#47
College Enrollment Per Capita
5,266
55.8
Ranked in U.S.
#38
Ranked in U.S.
#6
College Enrollment Per Capita
5,089
72.8
Ranked in U.S.
#48
Ranked in U.S.
#26
College Enrollment Per Capita
5,646
93.9
Ranked in U.S.
#50
Ranked in U.S.
#20
College Enrollment Per Capita
6,782
43.8
Ranked in U.S.
#23
Ranked in U.S.
#19
College Enrollment Per Capita
4,876
67.0
Ranked in U.S.
#42
Ranked in U.S.
#4
College Enrollment Per Capita
6,933
13.3
Ranked in U.S.
#2
Ranked in U.S.
#48
College Enrollment Per Capita
5,527
45.0
Ranked in U.S.
#24
Ranked in U.S.
#27
College Enrollment Per Capita
5,555
51.9
Ranked in U.S.
#33
Ranked in U.S.
#1
College Enrollment Per Capita
4,117
57.8
Ranked in U.S.
#39
Ranked in U.S.
#16
College Enrollment Per Capita
6,876
20.0
Ranked in U.S.
#5
Ranked in U.S.
#45
College Enrollment Per Capita
3,711
70.5
Ranked in U.S.
#45
Ranked in U.S.
#5
College Enrollment Per Capita
13,574
69.5
Ranked in U.S.
#44
Ranked in U.S.
#28
College Enrollment Per Capita
4,234
20.4
Ranked in U.S.
#6
Ranked in U.S.
#46
College Enrollment Per Capita
5,203
57.8
Ranked in U.S.
#40
Ranked in U.S.
#43
College Enrollment Per Capita
5,961
40.7
Ranked in U.S.
#19
Ranked in U.S.
#35
College Enrollment Per Capita
5,285
48.4
Ranked in U.S.
#28
Ranked in U.S.
#8
College Enrollment Per Capita
6,621
46.7
Ranked in U.S.
#26
Ranked in U.S.
#24
College Enrollment Per Capita
5,556
22.4
Ranked in U.S.
#8
Ranked in U.S.
#33
College Enrollment Per Capita
4,746
52.0
Ranked in U.S.
#34
Ranked in U.S.
#21
College Enrollment Per Capita
4,799
52.4
Ranked in U.S.
#35
Ranked in U.S.
#22
College Enrollment Per Capita
5,149
50.5
Ranked in U.S.
#31
Ranked in U.S.
#32
College Enrollment Per Capita
7,036
28.0
Ranked in U.S.
#10
Ranked in U.S.
#36
College Enrollment Per Capita
4,527
43.1
Ranked in U.S.
#22
Ranked in U.S.
#13
College Enrollment Per Capita
5,679
34.2
Ranked in U.S.
#13
Ranked in U.S.
#37
College Enrollment Per Capita
4,534
23.9
Ranked in U.S.
#9
Ranked in U.S.
#49
College Enrollment Per Capita
5,423
55.5
Ranked in U.S.
#37
Ranked in U.S.
#9
College Enrollment Per Capita
11,851
72.2
Ranked in U.S.
#46
Ranked in U.S.
#3
College Enrollment Per Capita
6,141
72.5
Ranked in U.S.
#47
Ranked in U.S.
#29
College Enrollment Per Capita
6,431
60.3
Ranked in U.S.
#41
Ranked in U.S.
#15
College Enrollment Per Capita
4,317
12.6
Ranked in U.S.
#1
Ranked in U.S.
#40
College Enrollment Per Capita
7,725
48.5
Ranked in U.S.
#29
Ranked in U.S.
#10
College Enrollment Per Capita
5,408
49.3
Ranked in U.S.
#30
Ranked in U.S.
#2
College Enrollment Per Capita
5,346