Maine
See More
92.6%
Ranked in U.S.
#8
Ranked in U.S.
#6
College Enrollment Per Capita
5,089
Last updated November 24, 2024
| 1. | New Hampshire | 94.2% | |
| 2. | Minnesota | 94.0% | |
| 3. | North Dakota | 93.7% | |
| 4. | Vermont | 93.4% | |
| 5. | South Dakota | 93.0% | |
| 6. | Nebraska | 92.7% | |
| 7. | Wisconsin | 92.7% | |
| 8. | Maine | 92.6% | |
| 9. | Missouri | 92.5% | |
| 10. | Iowa | 92.5% | |
| 11. | Kansas | 92.2% | |
| 12. | Indiana | 92.0% | |
| 13. | Michigan | 91.7% | |
| 14. | Rhode Island | 91.5% | |
| 15. | Connecticut | 91.4% | |
| 16. | Montana | 91.2% | |
| 17. | Wyoming | 91.1% | |
| 18. | Ohio | 90.9% | |
| 19. | Alaska | 90.8% | |
| 20. | Utah | 90.6% | |
| 21. | Washington | 90.2% | |
| 22. | Massachusetts | 90.1% | |
| 23. | Colorado | 90.1% | |
| 24. | Oregon | 89.8% | |
| 25. | Idaho | 89.5% | |
| 26. | Delaware | 89.3% | |
| 27. | Maryland | 88.8% | |
| 28. | Virginia | 88.0% | |
| 29. | Kentucky | 87.8% | |
| 30. | Oklahoma | 87.7% | |
| 31. | Pennsylvania | 87.4% | |
| 32. | Illinois | 87.1% | |
| 33. | Arizona | 86.9% | |
| 34. | Tennessee | 86.8% | |
| 35. | West Virginia | 86.6% | |
| 36. | North Carolina | 86.4% | |
| 37. | Arkansas | 86.3% | |
| 38. | South Carolina | 85.3% | |
| 39. | Alabama | 85.2% | |
| 40. | Hawaii | 84.1% | |
| 41. | Mississippi | 84.0% | |
| 42. | Louisiana | 84.0% | |
| 43. | Nevada | 83.9% | |
| 44. | New Mexico | 83.5% | |
| 45. | Georgia | 83.3% | |
| 46. | New Jersey | 83.1% | |
| 47. | Texas | 81.0% | |
| 48. | Florida | 80.3% | |
| 49. | New York | 77.9% | |
| 50. | California | 76.9% |
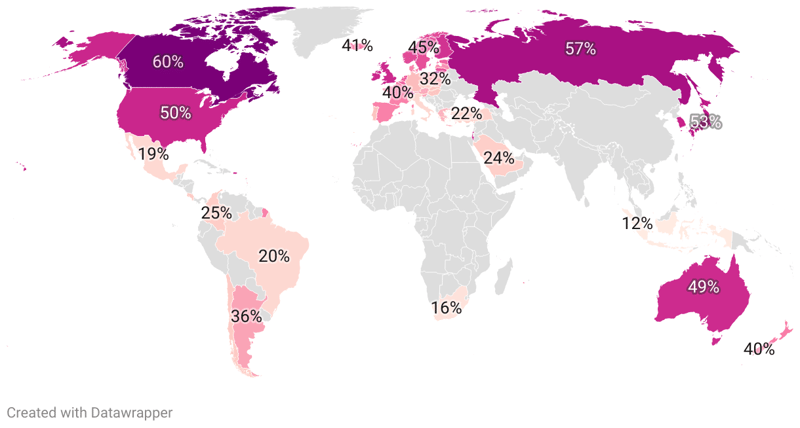
In the United States, the National Assessment of Adult Literacy has established three types of literacy skills: prose, document, and quantitative, and has emphasized their importance in today's workforce. Nevertheless, not every region in the U.S. has equal access to the resources shaping these skills and supporting literacy development, leading to varying literacy rates state by state.
Key Insights:
| Region ↕ | Literacy Rate↕ | High School Completion Rate↕ | College Enrollment Per Capita 2020↕ |
|---|---|---|---|
| 85.2% | 86.9% | 5,797 | |
| 90.8% | 93.1% | 3,017 | |
| 86.9% | 87.9% | 8,247 | |
| 86.3% | 87.2% | 4,934 | |
| 76.9% | 83.9% | 6,575 | |
| 90.1% | 92.1% | 6,233 | |
| 91.4% | 90.9% | 5,179 | |
| 89.3% | 90.6% | 5,848 | |
| 80.3% | 88.5% | 4,717 | |
| 83.3% | 87.9% | 5,069 | |
| 84.1% | 92.5% | 4,141 | |
| 89.5% | 91.3% | 6,470 | |
| 87.1% | 89.7% | 5,382 | |
| 92.0% | 89.3% | 6,038 | |
| 92.5% | 92.5% | 6,521 | |
| 92.2% | 91.4% | 6,581 | |
| 87.8% | 87.2% | 5,797 | |
| 84.0% | 85.9% | 5,266 | |
| 92.6% | 93.2% | 5,089 | |
| 88.8% | 90.6% | 5,646 | |
| 90.1% | 91.1% | 6,782 | |
| 91.7% | 91.3% | 4,876 | |
| 94.0% | 93.4% | 6,933 | |
| 84.0% | 85.3% | 5,527 | |
| 92.5% | 90.6% | 5,555 | |
| 91.2% | 94.0% | 4,117 | |
| 92.7% | 91.6% | 6,876 | |
| 83.9% | 86.9% | 3,711 | |
| 94.2% | 93.3% | 13,574 | |
| 83.1% | 90.3% | 4,234 | |
| 83.5% | 86.5% | 5,203 | |
| 77.9% | 87.2% | 5,961 | |
| 86.4% | 88.5% | 5,285 | |
| 93.7% | 93.1% | 6,621 | |
| 90.9% | 90.8% | 5,556 | |
| 87.7% | 88.6% | 4,746 | |
| 89.8% | 91.1% | 4,799 | |
| 87.4% | 91.0% | 5,149 | |
| 91.5% | 89.2% | 7,036 | |
| 85.3% | 88.3% | 4,527 | |
| 93.0% | 92.2% | 5,679 | |
| 86.8% | 88.2% | 4,534 | |
| 81.0% | 84.4% | 5,423 | |
| 90.6% | 93.0% | 11,851 | |
| 93.4% | 93.5% | 6,141 | |
| 88.0% | 90.3% | 6,431 | |
| 90.2% | 91.7% | 4,317 | |
| 86.6% | 87.6% | 7,725 | |
| 92.7% | 92.6% | 5,408 | |
| 91.1% | 93.6% | 5,346 |
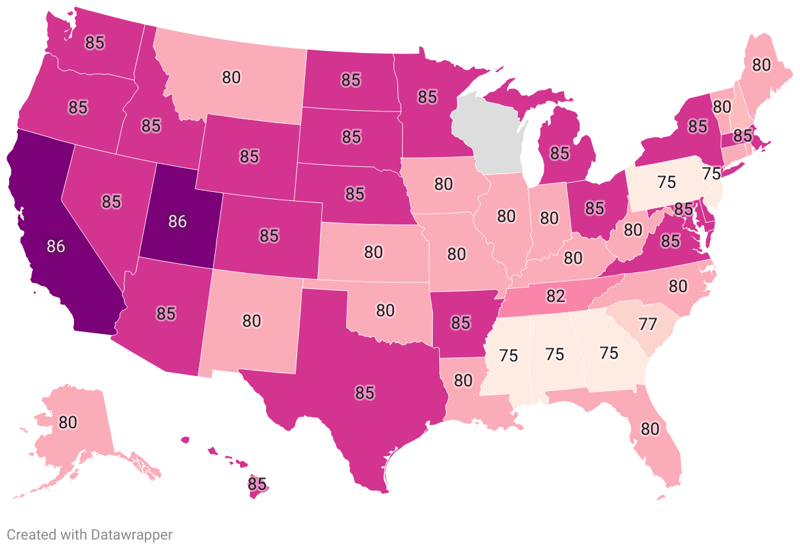
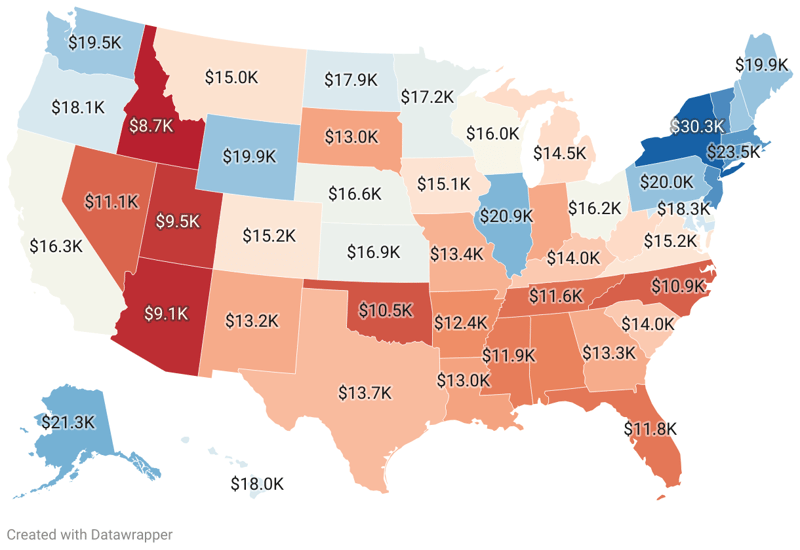
Educational strongholds mostly lie in the northeast and midwest regions of the United States, with New Hampshire leading the pack. The state possesses the highest literacy rate of 94.2%, indicating a strong emphasis on education and literacy within the community. With a close second, Minnesota boasts a literacy rate of 94.0%, in line with its long-standing commitment to education.
Following behind, we see North Dakota, another midwestern state, with a literacy rate of 93.7%. The Northeast feels its presence again, with Vermont securing the fourth place at 93.4% literacy. South Dakota, Nebraska, and Wisconsin are not far behind, marking literacy rates of 93.0%, 92.7%, and 92.7%, respectively.
Meanwhile, Maine stands out with a literacy rate of 92.6%, demonstrating a persistent commitment to improving educational outcomes in the state. Missouri and Iowa complete the top ten, each registering a literacy rate of 92.5%.
States with the Highest Literacy Rates
The last position is California, where the literacy rate is only 76.9%. This suggests that nearly a quarter of California's population struggles with reading and comprehending documents, significantly undermining those citizens' abilities to participate fully in modern society and the economy.
Not far ahead is New York, which has a literacy rate of 77.9%, followed by Florida at 80.3%. Texas is next in line with a literacy rate of 81.0%, indicating that almost one in five adult Texans likely encounter challenges when required to use written or printed information in their day-to-day lives.
New Jersey and Georgia are slightly better off, demonstrating literacy rates of 83.1% and 83.3%, respectively. New Mexico (83.5%), Nevada (83.9%), Louisiana (84.0%), and Mississippi (84.0%) round off the list, the latter two displaying identical literacy rates.
States with Lowest Literacy Rates:
85.2%
Ranked in U.S.
#39
Ranked in U.S.
#44
College Enrollment Per Capita
5,797
90.8%
Ranked in U.S.
#19
Ranked in U.S.
#7
College Enrollment Per Capita
3,017
86.9%
Ranked in U.S.
#33
Ranked in U.S.
#38
College Enrollment Per Capita
8,247
86.3%
Ranked in U.S.
#37
Ranked in U.S.
#41
College Enrollment Per Capita
4,934
76.9%
Ranked in U.S.
#50
Ranked in U.S.
#50
College Enrollment Per Capita
6,575
90.1%
Ranked in U.S.
#23
Ranked in U.S.
#14
College Enrollment Per Capita
6,233
91.4%
Ranked in U.S.
#15
Ranked in U.S.
#23
College Enrollment Per Capita
5,179
89.3%
Ranked in U.S.
#26
Ranked in U.S.
#25
College Enrollment Per Capita
5,848
80.3%
Ranked in U.S.
#48
Ranked in U.S.
#34
College Enrollment Per Capita
4,717
83.3%
Ranked in U.S.
#45
Ranked in U.S.
#39
College Enrollment Per Capita
5,069
84.1%
Ranked in U.S.
#40
Ranked in U.S.
#11
College Enrollment Per Capita
4,141
89.5%
Ranked in U.S.
#25
Ranked in U.S.
#18
College Enrollment Per Capita
6,470
87.1%
Ranked in U.S.
#32
Ranked in U.S.
#30
College Enrollment Per Capita
5,382
92.0%
Ranked in U.S.
#12
Ranked in U.S.
#31
College Enrollment Per Capita
6,038
92.5%
Ranked in U.S.
#10
Ranked in U.S.
#12
College Enrollment Per Capita
6,521
92.2%
Ranked in U.S.
#11
Ranked in U.S.
#17
College Enrollment Per Capita
6,581
87.8%
Ranked in U.S.
#29
Ranked in U.S.
#42
College Enrollment Per Capita
5,797
84.0%
Ranked in U.S.
#42
Ranked in U.S.
#47
College Enrollment Per Capita
5,266
92.6%
Ranked in U.S.
#8
Ranked in U.S.
#6
College Enrollment Per Capita
5,089
88.8%
Ranked in U.S.
#27
Ranked in U.S.
#26
College Enrollment Per Capita
5,646
90.1%
Ranked in U.S.
#22
Ranked in U.S.
#20
College Enrollment Per Capita
6,782
91.7%
Ranked in U.S.
#13
Ranked in U.S.
#19
College Enrollment Per Capita
4,876
94.0%
Ranked in U.S.
#2
Ranked in U.S.
#4
College Enrollment Per Capita
6,933
84.0%
Ranked in U.S.
#41
Ranked in U.S.
#48
College Enrollment Per Capita
5,527
92.5%
Ranked in U.S.
#9
Ranked in U.S.
#27
College Enrollment Per Capita
5,555
91.2%
Ranked in U.S.
#16
Ranked in U.S.
#1
College Enrollment Per Capita
4,117
92.7%
Ranked in U.S.
#6
Ranked in U.S.
#16
College Enrollment Per Capita
6,876
83.9%
Ranked in U.S.
#43
Ranked in U.S.
#45
College Enrollment Per Capita
3,711
94.2%
Ranked in U.S.
#1
Ranked in U.S.
#5
College Enrollment Per Capita
13,574
83.1%
Ranked in U.S.
#46
Ranked in U.S.
#28
College Enrollment Per Capita
4,234
83.5%
Ranked in U.S.
#44
Ranked in U.S.
#46
College Enrollment Per Capita
5,203
77.9%
Ranked in U.S.
#49
Ranked in U.S.
#43
College Enrollment Per Capita
5,961
86.4%
Ranked in U.S.
#36
Ranked in U.S.
#35
College Enrollment Per Capita
5,285
93.7%
Ranked in U.S.
#3
Ranked in U.S.
#8
College Enrollment Per Capita
6,621
90.9%
Ranked in U.S.
#18
Ranked in U.S.
#24
College Enrollment Per Capita
5,556
87.7%
Ranked in U.S.
#30
Ranked in U.S.
#33
College Enrollment Per Capita
4,746
89.8%
Ranked in U.S.
#24
Ranked in U.S.
#21
College Enrollment Per Capita
4,799
87.4%
Ranked in U.S.
#31
Ranked in U.S.
#22
College Enrollment Per Capita
5,149
91.5%
Ranked in U.S.
#14
Ranked in U.S.
#32
College Enrollment Per Capita
7,036
85.3%
Ranked in U.S.
#38
Ranked in U.S.
#36
College Enrollment Per Capita
4,527
93.0%
Ranked in U.S.
#5
Ranked in U.S.
#13
College Enrollment Per Capita
5,679
86.8%
Ranked in U.S.
#34
Ranked in U.S.
#37
College Enrollment Per Capita
4,534
81.0%
Ranked in U.S.
#47
Ranked in U.S.
#49
College Enrollment Per Capita
5,423
90.6%
Ranked in U.S.
#20
Ranked in U.S.
#9
College Enrollment Per Capita
11,851
93.4%
Ranked in U.S.
#4
Ranked in U.S.
#3
College Enrollment Per Capita
6,141
88.0%
Ranked in U.S.
#28
Ranked in U.S.
#29
College Enrollment Per Capita
6,431
90.2%
Ranked in U.S.
#21
Ranked in U.S.
#15
College Enrollment Per Capita
4,317
86.6%
Ranked in U.S.
#35
Ranked in U.S.
#40
College Enrollment Per Capita
7,725
92.7%
Ranked in U.S.
#7
Ranked in U.S.
#10
College Enrollment Per Capita
5,408
91.1%
Ranked in U.S.
#17
Ranked in U.S.
#2
College Enrollment Per Capita
5,346