Maine
See More
$60,639
Ranked in U.S.
#40
Last updated November 24, 2024

| 1. | New York | $105,309 | |
| 2. | Massachusetts | $98,705 | |
| 3. | North Dakota | $93,861 | |
| 4. | Washington | $92,648 | |
| 5. | California | $92,459 | |
| 6. | Connecticut | $88,686 | |
| 7. | Alaska | $86,793 | |
| 8. | Delaware | $84,812 | |
| 9. | Illinois | $82,813 | |
| 10. | Colorado | $82,537 | |
| 11. | Nebraska | $81,987 | |
| 12. | Wyoming | $81,321 | |
| 13. | New Jersey | $80,539 | |
| 14. | Minnesota | $78,020 | |
| 15. | Texas | $77,244 | |
| 16. | Maryland | $76,395 | |
| 17. | New Hampshire | $75,137 | |
| 18. | Virginia | $74,558 | |
| 19. | South Dakota | $73,170 | |
| 20. | Utah | $72,513 | |
| 21. | Iowa | $72,146 | |
| 22. | Kansas | $71,745 | |
| 23. | Pennsylvania | $71,380 | |
| 24. | Oregon | $70,816 | |
| 25. | Ohio | $70,028 | |
| 26. | Hawaii | $68,529 | |
| 27. | Georgia | $68,465 | |
| 28. | Wisconsin | $68,043 | |
| 29. | North Carolina | $67,399 | |
| 30. | Nevada | $67,282 | |
| 31. | Tennessee | $66,685 | |
| 32. | Indiana | $66,508 | |
| 33. | Rhode Island | $65,477 | |
| 34. | Missouri | $63,034 | |
| 35. | Vermont | $62,762 | |
| 36. | Michigan | $61,879 | |
| 37. | Louisiana | $61,807 | |
| 38. | Arizona | $61,575 | |
| 39. | Florida | $61,296 | |
| 40. | Maine | $60,639 | |
| 41. | Oklahoma | $59,415 | |
| 42. | New Mexico | $57,874 | |
| 43. | Kentucky | $57,614 | |
| 44. | Montana | $57,055 | |
| 45. | Idaho | $55,501 | |
| 46. | South Carolina | $55,078 | |
| 47. | Alabama | $54,487 | |
| 48. | West Virginia | $54,164 | |
| 49. | Arkansas | $53,938 | |
| 50. | Mississippi | $47,343 |
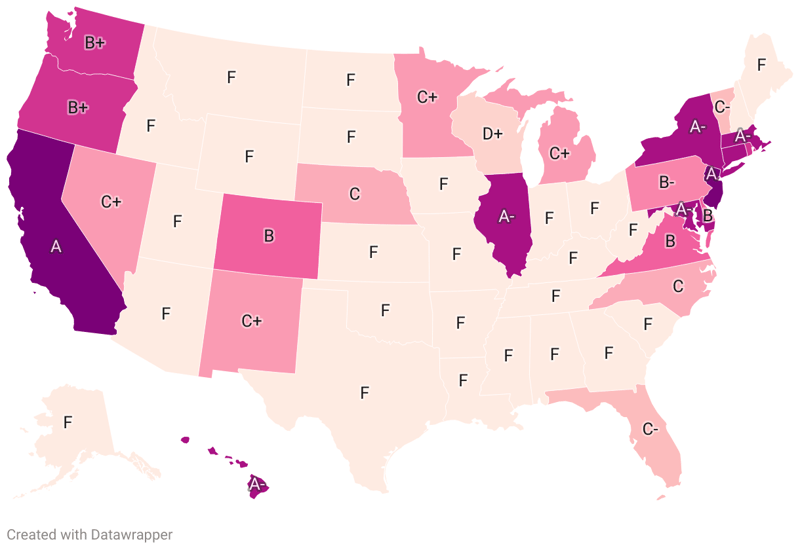
When discussing economic prosperity and growth, it is essential to examine the wealth distribution across the diverse states of America, particularly the richest ones. The financial health of each state is depicted by various indicators, and in this article, we focus on two: Gross Domestic Product (GDP) per capita, indicative of the market value of all officially recognized final goods and services produced within a state within a given period, and the state's median household income which reveals the income at the very middle of the income distribution — half of households earn more, half earn less.
Factors such as job opportunities, cost of living, and overall economic health contribute to the wealth accumulation in each state. Educational attainment, in particular, has demonstrated a strong correlation with median household income levels. A higher GDP per capita generally speaking, may result in better living standards and improved public services for residents, resonating to the state’s overall development.
Based on GDP per capita, the ten richest states in the U.S. are New York, Massachusetts, North Dakota, Washington, California, Connecticut, Alaska, Delaware, Illinois, and Colorado.
Leading the list is New York, boasting the highest GDP per capita of $105,309. New York's economy is majorly fueled by sectors such as finance and healthcare, with Wall Street playing a significant role in the state's economic performance.
Following closely is Massachusetts with a GDP per capita of $98,705. Known for its rich academic and cultural institutions, Massachusetts also hosts a booming technology and healthcare sector, contributing to its strong economic standing.
North Dakota comes in third place with a GDP per capita of $93,861, due to its rich natural resources and successful agriculture and energy industries. Washington and California, states thriving on technology and innovation, sit at fourth and fifth place respectively with GDP per capita figures of $92,648 and $92,459.
Connecticut, with a GDP per capita of $88,686, is home to many insurance corporate headquarters. Their economic strength is closely followed by Alaska, a state rich in natural resources, boasting a GDP per capita of $86,793.
Delaware, hosting numerous corporate headquarters due to its business-friendly laws, holds a GDP per capita of $84,812. Illinois and Colorado, known for diverse economy and a thriving tech industry respectively, round up the list with GDPs per capita of $82,813 and $82,537.
Richest States by GDP Per Capita:
$54,487
Ranked in U.S.
#47
$86,793
Ranked in U.S.
#7
$61,575
Ranked in U.S.
#38
$53,938
Ranked in U.S.
#49
$92,459
Ranked in U.S.
#5
$82,537
Ranked in U.S.
#10
$88,686
Ranked in U.S.
#6
$84,812
Ranked in U.S.
#8
$61,296
Ranked in U.S.
#39
$68,465
Ranked in U.S.
#27
$68,529
Ranked in U.S.
#26
$55,501
Ranked in U.S.
#45
$82,813
Ranked in U.S.
#9
$66,508
Ranked in U.S.
#32
$72,146
Ranked in U.S.
#21
$71,745
Ranked in U.S.
#22
$57,614
Ranked in U.S.
#43
$61,807
Ranked in U.S.
#37
$60,639
Ranked in U.S.
#40
$76,395
Ranked in U.S.
#16
$98,705
Ranked in U.S.
#2
$61,879
Ranked in U.S.
#36
$78,020
Ranked in U.S.
#14
$47,343
Ranked in U.S.
#50
$63,034
Ranked in U.S.
#34
$57,055
Ranked in U.S.
#44
$81,987
Ranked in U.S.
#11
$67,282
Ranked in U.S.
#30
$75,137
Ranked in U.S.
#17
$80,539
Ranked in U.S.
#13
$57,874
Ranked in U.S.
#42
$105,309
Ranked in U.S.
#1
$67,399
Ranked in U.S.
#29
$93,861
Ranked in U.S.
#3
$70,028
Ranked in U.S.
#25
$59,415
Ranked in U.S.
#41
$70,816
Ranked in U.S.
#24
$71,380
Ranked in U.S.
#23
$65,477
Ranked in U.S.
#33
$55,078
Ranked in U.S.
#46
$73,170
Ranked in U.S.
#19
$66,685
Ranked in U.S.
#31
$77,244
Ranked in U.S.
#15
$72,513
Ranked in U.S.
#20
$62,762
Ranked in U.S.
#35
$74,558
Ranked in U.S.
#18
$92,648
Ranked in U.S.
#4
$54,164
Ranked in U.S.
#48
$68,043
Ranked in U.S.
#28
$81,321
Ranked in U.S.
#12
| Region ↕ | GPD Per Capita 2023↕ |
|---|---|
| $54,487 | |
| $86,793 | |
| $61,575 | |
| $53,938 | |
| $92,459 | |
| $82,537 | |
| $88,686 | |
| $84,812 | |
| $61,296 | |
| $68,465 | |
| $68,529 | |
| $55,501 | |
| $82,813 | |
| $66,508 | |
| $72,146 | |
| $71,745 | |
| $57,614 | |
| $61,807 | |
| $60,639 | |
| $76,395 | |
| $98,705 | |
| $61,879 | |
| $78,020 | |
| $47,343 | |
| $63,034 | |
| $57,055 | |
| $81,987 | |
| $67,282 | |
| $75,137 | |
| $80,539 | |
| $57,874 | |
| $105,309 | |
| $67,399 | |
| $93,861 | |
| $70,028 | |
| $59,415 | |
| $70,816 | |
| $71,380 | |
| $65,477 | |
| $55,078 | |
| $73,170 | |
| $66,685 | |
| $77,244 | |
| $72,513 | |
| $62,762 | |
| $74,558 | |
| $92,648 | |
| $54,164 | |
| $68,043 | |
| $81,321 |