These Numbers Do Not Mean What Most People Think They Mean
Every number in this ranking comes from cases reported to police and submitted to the United Nations Office on Drugs and Crime. That distinction matters more here than in almost any other dataset. Rape is one of the most underreported crimes in the world, and the gap between reported cases and actual prevalence varies wildly depending on the country's legal system, cultural norms, and how much trust women place in local police.
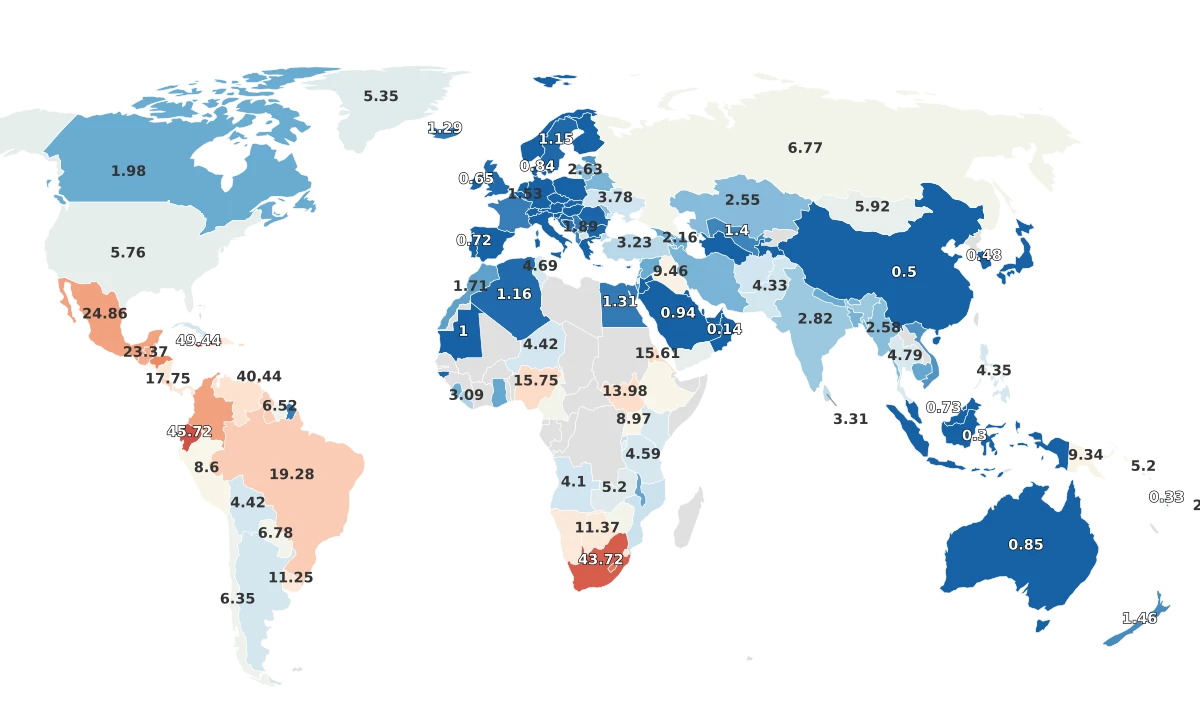
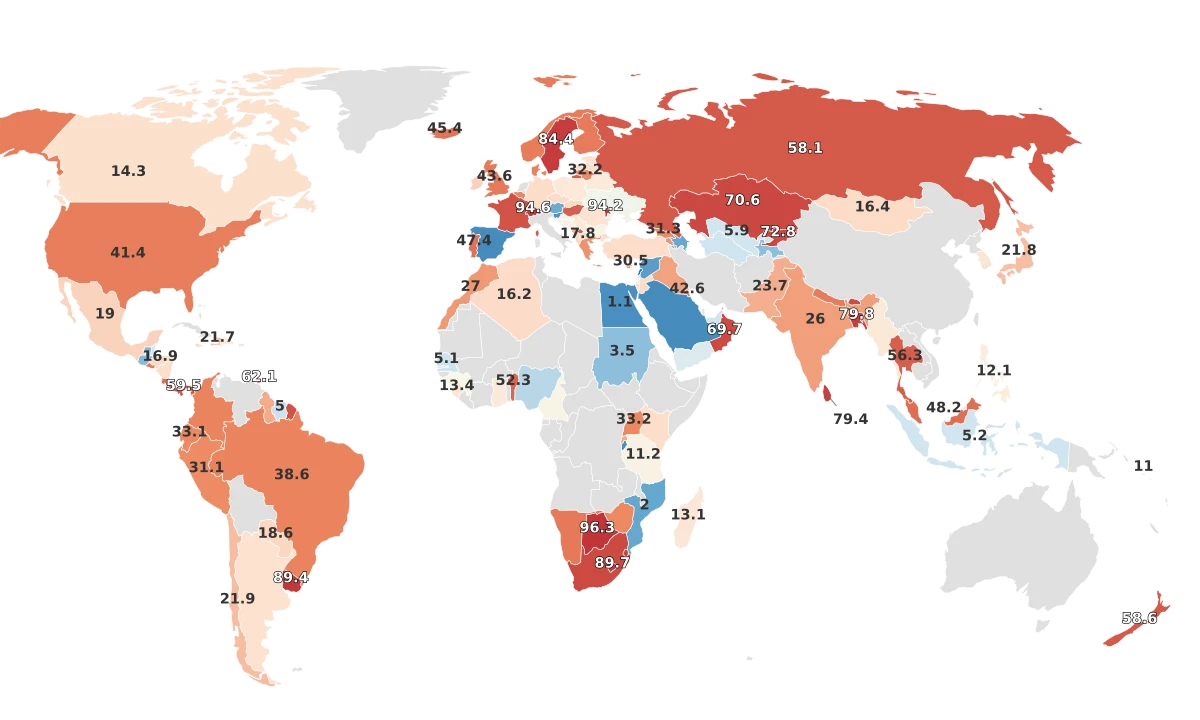
The range across 143 countries is enormous. Botswana leads the ranking at 96.3 reported rapes per 100,000 people. Lebanon sits at the bottom with 0.2. But those extremes say far less about where sexual violence is most common than about where it is most likely to be documented. Botswana's government has declared its rape crisis a "national emergency." Lebanon's legal system does not recognize marital rape and provides pathways for rapists to avoid prosecution by marrying their victims.
The distribution is heavily skewed. A small number of countries with very high reported rates pull the global picture upward, while the vast majority cluster below 20 per 100,000. That skew reflects a measurement reality: most countries significantly undercount.
The UNODC itself warns that these statistics "should be used with caution for international comparisons." Three factors create the largest distortions: how broadly a country defines rape in its criminal code, whether police record each incident separately or group repeated assaults as a single case, and how willing victims are to report in the first place. Each of those factors can shift a country's position in this ranking by dozens of places.
Why Some of the Safest Countries for Women Report the Most Rapes
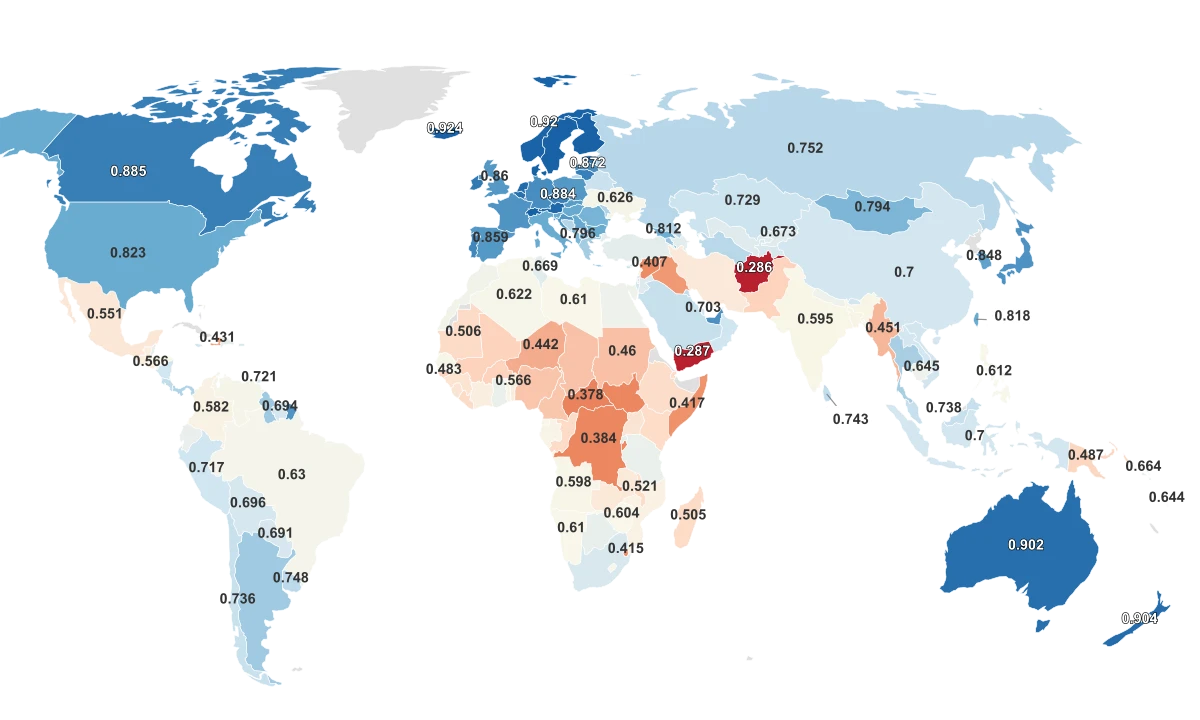
By virtually every safety and equality metric, the Nordic countries are among the best places in the world to be a woman. Denmark ranks first on the Women's Danger Index (0.932 out of 1.0). Sweden ranks third (0.926). Finland and Norway rank sixth and seventh. Yet all four report rape rates well above the global average: Sweden at 84.4 per 100,000, Finland at 42.5, Norway at 42.1, and Denmark at 39.9.
Researchers call this the "Nordic Paradox." Countries with the highest gender equality tend to report the highest rates of sexual violence. The explanation is not that these countries are more dangerous. It is that they have removed more of the barriers that prevent reporting everywhere else.
Sweden is the clearest example. In 2018, Sweden enacted the Consent Law (samtyckeslagen), which made sex without explicit and active consent a criminal offense. Silence or passivity does not count as consent. That law broadened the legal definition of rape beyond what nearly any other country recognizes. Sweden also records each act of sexual violence as a separate offense. If one person assaults another person repeatedly over weeks, Swedish police log each incident individually. In most other countries, that entire pattern would be recorded as a single case.
Switzerland illustrates the same dynamic from a different angle. It ranks second in the entire dataset at 94.6 per 100,000, yet scores 0.928 on the Women's Danger Index, the second-safest country for women globally. Switzerland reformed its sexual offense laws in June 2023, adopting a consent-based "no means no" framework. Before the reform, prosecutors had to prove violence or threats. A 2019 Amnesty International survey found that one in five Swiss women over 16 had experienced sexual violence, but fewer than 8% reported it to police. The prevalence is alarming on its own terms, but the high rank in this dataset also reflects a legal system that is now capturing more of what other countries still leave uncounted.
Where the Numbers Are Lowest, Women Are Often Least Safe
The countries at the bottom of this ranking should not be mistaken for the safest. Lebanon reports 0.2 rapes per 100,000. Saudi Arabia reports 1.0. Egypt reports 1.1. Syria reports 1.5. These are among the lowest figures in the dataset, yet independent research consistently identifies them as among the most dangerous places for women in the world.
The Women's Danger Index confirms this inversion. Afghanistan scores 0.286, Yemen 0.287, and the Central African Republic 0.378, placing them at the very bottom of the safety scale. Syria scores 0.407. Yet Afghanistan does not appear in the rape rate data at all, Yemen reports just 6.8, and Syria reports 1.5. The gap between reported numbers and measured danger is an abyss.
The structural causes are well documented. In several countries near the bottom of this ranking, marital rape is not a crime. Reporting a rape can lead to prosecution of the victim under adultery or extramarital sex laws. Police may refuse to file reports, or families may suppress them to protect "honor." In some jurisdictions, a rapist can avoid prosecution entirely by marrying the victim.
India illustrates the underreporting problem with unusual clarity. It reports 26.0 per 100,000, a figure that places it in the middle of the dataset. But India's National Crime Records Bureau acknowledges systematic gaps: marital rape is not criminalized, police are frequently criticized for refusing to register complaints, and conviction rates hover around 27 to 28%. Estimates from Indian researchers and press reports suggest that as many as 99% of rapes go unreported. If even a fraction of that estimate is accurate, India's true rate would be among the highest in the world.
Five Countries Account for Over Half of All Reported Cases
When measured by absolute count rather than rate, the concentration is striking. Just five countries account for 58% of all reported rapes in the dataset: the United States (141,486 reported cases), Brazil (81,603), France (41,652), South Africa (40,035), and India (33,707). The total across all 143 countries is roughly 582,000.
Population explains part of this. The five countries listed above include three of the world's five most populous nations. A country with 330 million people will naturally report more total cases than one with 2 million, even at the same per-capita rate.
But population is not the whole story. South Africa has roughly 60 million people and reports 40,035 cases, giving it a rate of 69.5 per 100,000. That sits 14th in the per-capita ranking, placing it alongside countries with very different profiles. South Africa's crisis is structural: organizations like the Centre for the Study of Violence and Reconciliation have linked it to the normalization of violence during and after apartheid, deep economic inequality, and persistently low conviction rates that fail to deter offenders.
France has broadened its legal definition of sexual violence significantly in recent years, contributing to both its high absolute count and its above-average rate of 62.7 per 100,000. Like Sweden and Switzerland, France's numbers partly reflect a legal system that is catching more of what was previously invisible.
Why These Rankings Cannot Tell You Where Women Are Safest
The most revealing pattern in this dataset is not which country ranks first or last. It is how little these rankings correlate with any other measure of safety.
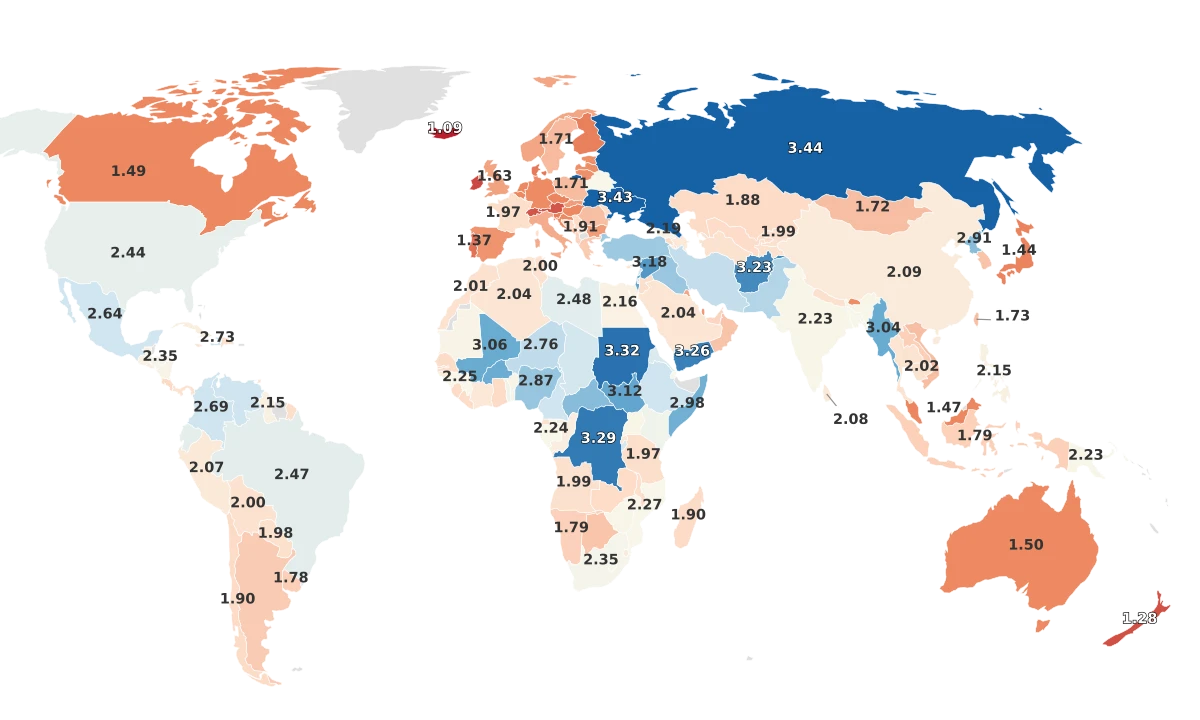
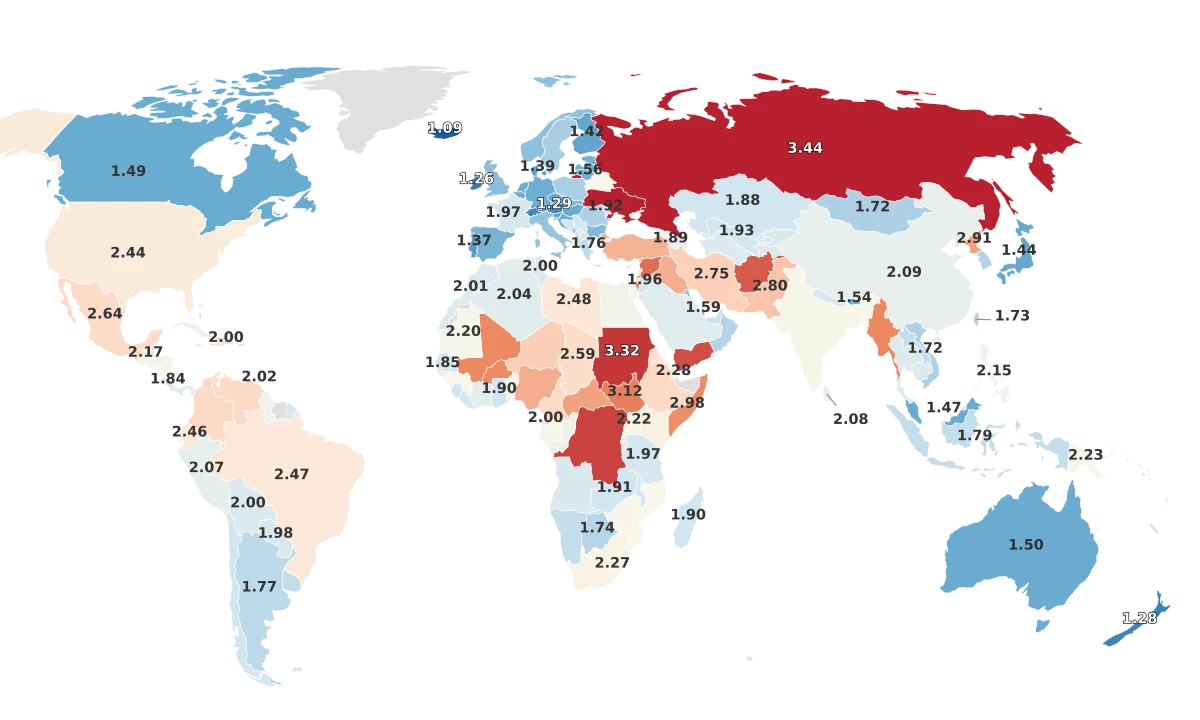
The statistical relationship between a country's reported rape rate and its overall Crime Index is essentially zero. Countries with high crime indexes, like Haiti (81.0) and Venezuela (80.5), do not necessarily report high rape rates. Countries with very low crime indexes, like Switzerland (26.7) and Singapore (22.6), nevertheless appear near the top of the rape rate ranking. The two metrics move independently of each other.
Reported Rape Rates Have Almost No Connection to Overall Crime Levels
Countries with the highest crime perception indexes do not report the highest rape rates, and vice versa, because rape statistics primarily reflect reporting infrastructure.
The relationship between rape rates and the Women's Danger Index is even more counterintuitive. The data shows a weak positive correlation: countries where women are safer tend to report more rapes. That pattern would make no sense if the ranking measured actual prevalence. It makes perfect sense if it measures reporting: women in safer societies are more likely to come forward, more likely to have their claims recorded, and more likely to be protected by legal definitions broad enough to capture what happened to them.
This does not mean high-ranking countries should be complacent. Botswana (96.3 per 100,000) faces a genuine crisis that its government has publicly acknowledged. Lesotho (89.7) and Eswatini (75.2) sit in a region of southern Africa where sexual violence is deeply embedded in social structures. Not every high rank reflects good reporting infrastructure alone.
But the critical takeaway is this: any country reporting fewer than 5 rapes per 100,000 people is almost certainly undercounting by an enormous margin. The real question this data answers is not "where does rape happen most?" It is "where are women most able to report it?"