Last updated September 18, 2024

| 1. | United States | $26.8T | |
| 2. | China | $19.4T | |
| 3. | Japan | $4.4T | |
| 4. | Germany | $4.3T | |
| 5. | India | $3.7T | |
| 6. | United Kingdom | $3.1T | |
| 7. | France | $2.9T | |
| 8. | Italy | $2.2T | |
| 9. | Canada | $2.1T | |
| 10. | Brazil | $2.1T | |
| 11. | Russia | $2.1T | |
| 12. | South Korea | $1.7T | |
| 13. | Australia | $1.7T | |
| 14. | Mexico | $1.6T | |
| 15. | Spain | $1.5T | |
| 16. | Indonesia | $1.4T | |
| 17. | Netherlands | $1.1T | |
| 18. | Saudi Arabia | $1.1T | |
| 19. | Turkey | $1.0T | |
| 20. | Switzerland | $869.6B | |
| 21. | Taiwan | $790.7B | |
| 22. | Poland | $748.9B | |
| 23. | Argentina | $641.1B | |
| 24. | Belgium | $624.2B | |
| 25. | Sweden | $599.1B | |
| 26. | Ireland | $594.1B | |
| 27. | Thailand | $574.2B | |
| 28. | Norway | $554.1B | |
| 29. | Israel | $539.2B | |
| 30. | Singapore | $515.5B | |
| 31. | Austria | $515.2B | |
| 32. | Nigeria | $506.6B | |
| 33. | United Arab Emirates | $499.0B | |
| 34. | Vietnam | $449.1B | |
| 35. | Malaysia | $447.0B | |
| 36. | Philippines | $440.9B | |
| 37. | Bangladesh | $420.5B | |
| 38. | Denmark | $405.6B | |
| 39. | South Africa | $399.0B | |
| 40. | Hong Kong | $382.9B | |
| 41. | Egypt | $378.1B | |
| 42. | Pakistan | $376.5B | |
| 43. | Iran | $368.0B | |
| 44. | Chile | $358.6B | |
| 45. | Romania | $348.9B | |
| 46. | Colombia | $334.7B | |
| 47. | Czech Republic | $330.5B | |
| 48. | Finland | $301.7B | |
| 49. | Peru | $268.2B | |
| 50. | Iraq | $267.9B | |
| 51. | Portugal | $267.7B | |
| 52. | New Zealand | $252.0B | |
| 53. | Kazakhstan | $245.7B | |
| 54. | Greece | $239.3B | |
| 55. | Qatar | $219.6B | |
| 56. | Algeria | $206.0B | |
| 57. | Hungary | $188.5B | |
| 58. | Kuwait | $164.7B | |
| 59. | Ethiopia | $156.1B | |
| 60. | Ukraine | $148.7B | |
| 61. | Morocco | $138.8B | |
| 62. | Slovakia | $127.5B | |
| 63. | Ecuador | $121.3B | |
| 64. | Dominican Republic | $121.3B | |
| 65. | Puerto Rico | $120.8B | |
| 66. | Kenya | $118.1B | |
| 67. | Angola | $117.9B | |
| 68. | Oman | $104.9B | |
| 69. | Guatemala | $102.3B | |
| 70. | Bulgaria | $100.6B | |
| 71. | Venezuela | $96.6B | |
| 72. | Uzbekistan | $92.3B | |
| 73. | Luxembourg | $87.0B | |
| 74. | Tanzania | $85.4B | |
| 75. | Turkmenistan | $82.6B | |
| 76. | Croatia | $78.9B | |
| 77. | Lithuania | $78.3B | |
| 78. | Costa Rica | $77.8B | |
| 79. | Uruguay | $77.3B | |
| 80. | Panama | $77.3B | |
| 81. | Ivory Coast | $77.0B | |
| 82. | Sri Lanka | $75.3B | |
| 83. | Serbia | $74.0B | |
| 84. | Belarus | $73.5B | |
| 85. | Azerbaijan | $70.0B | |
| 86. | DR Congo | $69.5B | |
| 87. | Slovenia | $68.1B | |
| 88. | Ghana | $66.6B | |
| 89. | Myanmar | $64.0B | |
| 90. | Jordan | $52.1B | |
| 91. | Tunisia | $49.8B | |
| 92. | Uganda | $49.8B | |
| 93. | Cameroon | $48.6B | |
| 94. | Latvia | $47.4B | |
| 95. | Sudan | $46.7B | |
| 96. | Libya | $46.3B | |
| 97. | Bolivia | $46.1B | |
| 98. | Bahrain | $44.9B | |
| 99. | Paraguay | $42.8B | |
| 100. | Nepal | $42.1B | |
| 101. | Estonia | $41.6B | |
| 102. | Macau | $35.8B | |
| 103. | El Salvador | $33.8B | |
| 104. | Honduras | $32.9B | |
| 105. | Papua New Guinea | $31.4B | |
| 106. | Senegal | $31.2B | |
| 107. | Cyprus | $30.9B | |
| 108. | Cambodia | $30.6B | |
| 109. | Zimbabwe | $29.9B | |
| 110. | Zambia | $29.3B | |
| 111. | Iceland | $28.6B | |
| 112. | Bosnia and Herzegovina | $28.5B | |
| 113. | Trinidad and Tobago | $28.2B | |
| 114. | Georgia | $27.9B | |
| 115. | Haiti | $26.6B | |
| 116. | Lebanon | $24.5B | |
| 117. | Armenia | $23.7B | |
| 118. | Guinea | $23.3B | |
| 119. | Burkina Faso | $21.1B | |
| 120. | Mali | $20.8B | |
| 121. | Gabon | $20.3B | |
| 122. | Albania | $20.2B | |
| 123. | Afghanistan | $20.1B | |
| 124. | Mozambique | $19.9B | |
| 125. | Palestine | $19.7B | |
| 126. | Botswana | $19.6B | |
| 127. | Yemen | $19.5B | |
| 128. | Malta | $19.4B | |
| 129. | Benin | $19.2B | |
| 130. | Nicaragua | $17.3B | |
| 131. | Jamaica | $17.3B | |
| 132. | Mongolia | $16.9B | |
| 133. | Niger | $16.6B | |
| 134. | Guyana | $16.3B | |
| 135. | Brunei | $16.0B | |
| 136. | Madagascar | $16.0B | |
| 137. | Moldova | $15.8B | |
| 138. | North Macedonia | $15.3B | |
| 139. | Equatorial Guinea | $15.1B | |
| 140. | Mauritius | $14.6B | |
| 141. | Bahamas | $14.1B | |
| 142. | Laos | $14.1B | |
| 143. | Namibia | $13.5B | |
| 144. | Rwanda | $13.1B | |
| 145. | Republic of the Congo | $13.0B | |
| 146. | Tajikistan | $12.8B | |
| 147. | Kyrgyzstan | $12.3B | |
| 148. | Chad | $12.0B | |
| 149. | Malawi | $11.3B | |
| 150. | Mauritania | $11.0B | |
| 151. | Kosovo | $10.0B | |
| 152. | Togo | $9.0B | |
| 153. | Somalia | $8.7B | |
| 154. | Montenegro | $7.0B | |
| 155. | South Sudan | $7.0B | |
| 156. | Maldives | $7.0B | |
| 157. | Barbados | $6.1B | |
| 158. | Fiji | $5.4B | |
| 159. | Eswatini | $4.8B | |
| 160. | Liberia | $4.4B | |
| 161. | Djibouti | $3.9B | |
| 162. | Andorra | $3.7B | |
| 163. | Aruba | $3.6B | |
| 164. | Sierra Leone | $3.5B | |
| 165. | Suriname | $3.5B | |
| 166. | Burundi | $3.2B | |
| 167. | Belize | $3.2B | |
| 168. | Central African Republic | $2.7B | |
| 169. | Bhutan | $2.7B | |
| 170. | Eritrea | $2.7B | |
| 171. | Lesotho | $2.6B | |
| 172. | Cape Verde | $2.5B | |
| 173. | Gambia | $2.3B | |
| 174. | Saint Lucia | $2.3B | |
| 175. | Timor Leste | $2.0B | |
| 176. | Seychelles | $2.0B | |
| 177. | Guinea Bissau | $1.9B | |
| 178. | Antigua and Barbuda | $1.9B | |
| 179. | San Marino | $1.8B | |
| 180. | Solomon Islands | $1.7B | |
| 181. | Comoros | $1.3B | |
| 182. | Grenada | $1.3B | |
| 183. | Vanuatu | $1.1B | |
| 184. | Saint Kitts and Nevis | $1.1B | |
| 185. | Saint Vincent and the Grenadines | $1.0B | |
| 186. | Samoa | $898.0M | |
| 187. | Dominica | $681.0M | |
| 188. | Sao Tome and Principe | $625.0M | |
| 189. | Tonga | $541.0M | |
| 190. | Micronesia | $456.0M | |
| 191. | Marshall Islands | $291.0M | |
| 192. | Palau | $262.0M | |
| 193. | Kiribati | $248.0M | |
| 194. | Nauru | $151.0M | |
| 195. | Tuvalu | $65.0M |
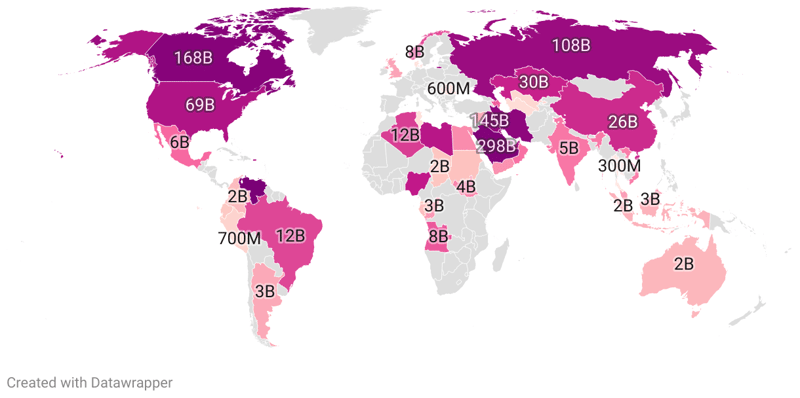
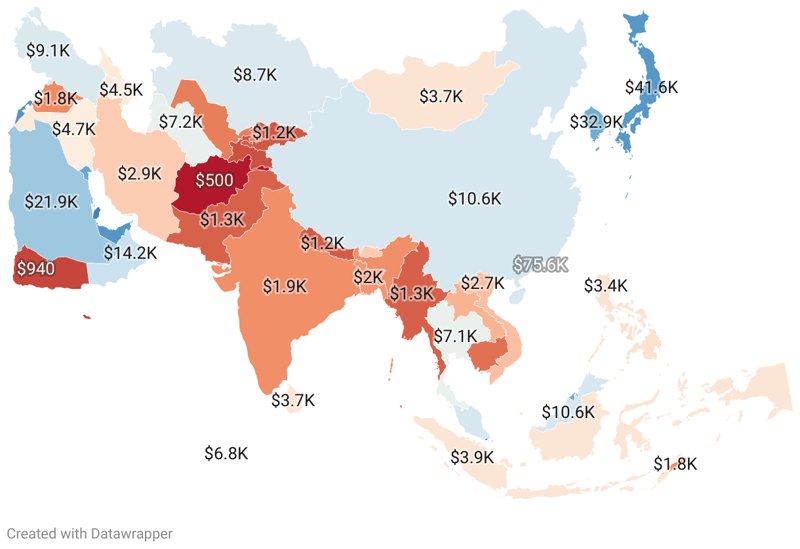
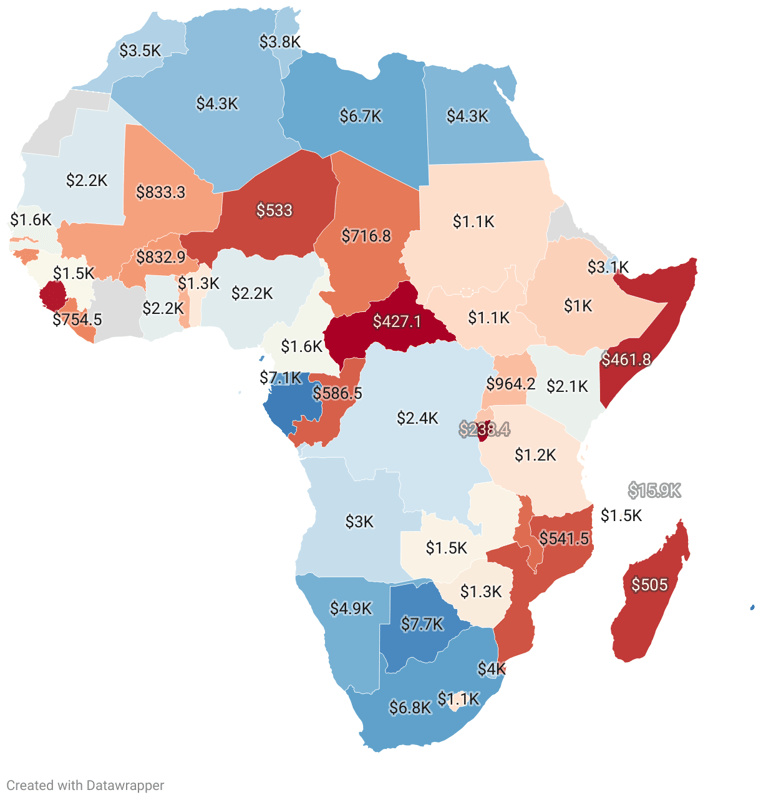
In our increasingly interconnected world, each country's ability to wield power on the global arena is crucial. This power often correlates directly to economic prowess, which we can measure using the Gross Domestic Product (GDP) – an essential indicator of a country's economic health and standard of living. The GDP quantifies the value of all final goods and services produced within a country over a set period, providing a snapshot of that country's global economic standing. Key findings from the data include:
First, the United States stands tall with an intimidating GDP of $26.8 trillion, making it the world's most potent economic powerhouse. This position allows the U.S. to maintain a significant impact on international relations, world markets, and global issues of critical importance. Following closely, China, with a GDP of $19.4 trillion, serves as the second most economically influential country in the world. Though still trailing the U.S., China's rapid economic growth should not be understated, as it views the global throne with ambitious eyes. Continuing our exploration, Japan, with a GDP of $4.4 trillion, demonstrates significant economic might. It signifies the rising prominence of Asian economies on the global stage. Not far behind, European economic powerhouses Germany ($4.3 trillion GDP) and the United Kingdom ($3.1 trillion GDP) exhibit their strength and influence with high GDPs. While geographically smaller, their economic, cultural, and political influences echo on the global stage. India, with a GDP of $3.7 trillion, shows its rising economic stature in the global arena, emphasizing Asia's growing economic clout. Rounding out the top ten, France, Italy, Canada, and Brazil, with GDPs ranging from $2.1 to $2.9 trillion, further underline the globally distributed nature of economic power.
10 Most Powerful Countries:
$20.1B
Ranked in World
#123
$20.2B
Ranked in World
#122
$206.0B
Ranked in World
#56
$3.7B
Ranked in World
#162
$117.9B
Ranked in World
#67
$1.9B
Ranked in World
#178
$641.1B
Ranked in World
#23
$23.7B
Ranked in World
#117
$3.6B
Ranked in World
#163
$1.7T
Ranked in World
#13
$515.2B
Ranked in World
#31
$70.0B
Ranked in World
#85
$14.1B
Ranked in World
#141
$44.9B
Ranked in World
#98
$420.5B
Ranked in World
#37
$6.1B
Ranked in World
#157
$73.5B
Ranked in World
#84
$624.2B
Ranked in World
#24
$3.2B
Ranked in World
#167
$19.2B
Ranked in World
#129
$2.7B
Ranked in World
#169
$46.1B
Ranked in World
#97
$28.5B
Ranked in World
#112
$19.6B
Ranked in World
#126
$2.1T
Ranked in World
#10
$16.0B
Ranked in World
#135
$100.6B
Ranked in World
#70
$21.1B
Ranked in World
#119
$3.2B
Ranked in World
#166
$30.6B
Ranked in World
#108
$48.6B
Ranked in World
#93
$2.1T
Ranked in World
#9
$2.5B
Ranked in World
#172
$2.7B
Ranked in World
#168
$12.0B
Ranked in World
#148
$358.6B
Ranked in World
#44
$19.4T
Ranked in World
#2
$334.7B
Ranked in World
#46
$1.3B
Ranked in World
#181
$77.8B
Ranked in World
#78
$78.9B
Ranked in World
#76
$30.9B
Ranked in World
#107
$330.5B
Ranked in World
#47
$69.5B
Ranked in World
#86
$405.6B
Ranked in World
#38
$3.9B
Ranked in World
#161
$681.0M
Ranked in World
#187
$121.3B
Ranked in World
#64
$121.3B
Ranked in World
#63
$378.1B
Ranked in World
#41
$33.8B
Ranked in World
#103
$15.1B
Ranked in World
#139
$2.7B
Ranked in World
#170
$41.6B
Ranked in World
#101
$4.8B
Ranked in World
#159
$156.1B
Ranked in World
#59
$5.4B
Ranked in World
#158
$301.7B
Ranked in World
#48
$2.9T
Ranked in World
#7
$20.3B
Ranked in World
#121
$2.3B
Ranked in World
#173
$27.9B
Ranked in World
#114
$4.3T
Ranked in World
#4
$66.6B
Ranked in World
#88
$239.3B
Ranked in World
#54
$1.3B
Ranked in World
#182
$102.3B
Ranked in World
#69
$23.3B
Ranked in World
#118
$1.9B
Ranked in World
#177
$16.3B
Ranked in World
#134
$26.6B
Ranked in World
#115
$32.9B
Ranked in World
#104
$382.9B
Ranked in World
#40
$188.5B
Ranked in World
#57
$28.6B
Ranked in World
#111
$3.7T
Ranked in World
#5
$1.4T
Ranked in World
#16
$368.0B
Ranked in World
#43
$267.9B
Ranked in World
#50
$594.1B
Ranked in World
#26
$539.2B
Ranked in World
#29
$2.2T
Ranked in World
#8
$77.0B
Ranked in World
#81
$17.3B
Ranked in World
#131
$4.4T
Ranked in World
#3
$52.1B
Ranked in World
#90
$245.7B
Ranked in World
#53
$118.1B
Ranked in World
#66
$248.0M
Ranked in World
#193
$10.0B
Ranked in World
#151
$164.7B
Ranked in World
#58
$12.3B
Ranked in World
#147
$14.1B
Ranked in World
#142
$47.4B
Ranked in World
#94
$24.5B
Ranked in World
#116
$2.6B
Ranked in World
#171
$4.4B
Ranked in World
#160
$46.3B
Ranked in World
#96
$78.3B
Ranked in World
#77
$87.0B
Ranked in World
#73
$35.8B
Ranked in World
#102
$16.0B
Ranked in World
#136
$11.3B
Ranked in World
#149
$447.0B
Ranked in World
#35
$7.0B
Ranked in World
#156
$20.8B
Ranked in World
#120
$19.4B
Ranked in World
#128
$291.0M
Ranked in World
#191
$11.0B
Ranked in World
#150
$14.6B
Ranked in World
#140
$1.6T
Ranked in World
#14
$456.0M
Ranked in World
#190
$15.8B
Ranked in World
#137
$16.9B
Ranked in World
#132
$7.0B
Ranked in World
#154
$138.8B
Ranked in World
#61
$19.9B
Ranked in World
#124
$64.0B
Ranked in World
#89
$13.5B
Ranked in World
#143
$151.0M
Ranked in World
#194
$42.1B
Ranked in World
#100
$1.1T
Ranked in World
#17
$252.0B
Ranked in World
#52
$17.3B
Ranked in World
#130
$16.6B
Ranked in World
#133
$506.6B
Ranked in World
#32
$15.3B
Ranked in World
#138
$554.1B
Ranked in World
#28
$104.9B
Ranked in World
#68
$376.5B
Ranked in World
#42
$262.0M
Ranked in World
#192
$19.7B
Ranked in World
#125
$77.3B
Ranked in World
#80
$31.4B
Ranked in World
#105
$42.8B
Ranked in World
#99
$268.2B
Ranked in World
#49
$440.9B
Ranked in World
#36
$748.9B
Ranked in World
#22
$267.7B
Ranked in World
#51
$120.8B
Ranked in World
#65
$219.6B
Ranked in World
#55
$13.0B
Ranked in World
#145
$348.9B
Ranked in World
#45
$2.1T
Ranked in World
#11
$13.1B
Ranked in World
#144
$1.1B
Ranked in World
#184
$2.3B
Ranked in World
#174
$1.0B
Ranked in World
#185
$898.0M
Ranked in World
#186
$1.8B
Ranked in World
#179
$625.0M
Ranked in World
#188
$1.1T
Ranked in World
#18
$31.2B
Ranked in World
#106
$74.0B
Ranked in World
#83
$2.0B
Ranked in World
#176
$3.5B
Ranked in World
#164
$515.5B
Ranked in World
#30
$127.5B
Ranked in World
#62
$68.1B
Ranked in World
#87
$1.7B
Ranked in World
#180
$8.7B
Ranked in World
#153
$399.0B
Ranked in World
#39
$1.7T
Ranked in World
#12
$7.0B
Ranked in World
#155
$1.5T
Ranked in World
#15
$75.3B
Ranked in World
#82
$46.7B
Ranked in World
#95
$3.5B
Ranked in World
#165
$599.1B
Ranked in World
#25
$869.6B
Ranked in World
#20
$790.7B
Ranked in World
#21
$12.8B
Ranked in World
#146
$85.4B
Ranked in World
#74
$574.2B
Ranked in World
#27
$2.0B
Ranked in World
#175
$9.0B
Ranked in World
#152
$541.0M
Ranked in World
#189
$28.2B
Ranked in World
#113
$49.8B
Ranked in World
#91
$1.0T
Ranked in World
#19
$82.6B
Ranked in World
#75
$65.0M
Ranked in World
#195
$49.8B
Ranked in World
#92
$148.7B
Ranked in World
#60
$499.0B
Ranked in World
#33
$3.1T
Ranked in World
#6
$26.8T
Ranked in World
#1
$77.3B
Ranked in World
#79
$92.3B
Ranked in World
#72
$1.1B
Ranked in World
#183
$96.6B
Ranked in World
#71
$449.1B
Ranked in World
#34
$19.5B
Ranked in World
#127
$29.3B
Ranked in World
#110
$29.9B
Ranked in World
#109
| Region ↕ | GDP↕ |
|---|---|
| $20.1B | |
| $20.2B | |
| $206.0B | |
| $3.7B | |
| $117.9B | |
| $1.9B | |
| $641.1B | |
| $23.7B | |
| $3.6B | |
| $1.7T | |
| $515.2B | |
| $70.0B | |
| $14.1B | |
| $44.9B | |
| $420.5B | |
| $6.1B | |
| $73.5B | |
| $624.2B | |
| $3.2B | |
| $19.2B | |
| $2.7B | |
| $46.1B | |
| $28.5B | |
| $19.6B | |
| $2.1T | |
| $16.0B | |
| $100.6B | |
| $21.1B | |
| $3.2B | |
| $30.6B | |
| $48.6B | |
| $2.1T | |
| $2.5B | |
| $2.7B | |
| $12.0B | |
| $358.6B | |
| $19.4T | |
| $334.7B | |
| $1.3B | |
| $77.8B | |
| $78.9B | |
| $30.9B | |
| $330.5B | |
| $69.5B | |
| $405.6B | |
| $3.9B | |
| $681.0M | |
| $121.3B | |
| $121.3B | |
| $378.1B | |
| $33.8B | |
| $15.1B | |
| $2.7B | |
| $41.6B | |
| $4.8B | |
| $156.1B | |
| $5.4B | |
| $301.7B | |
| $2.9T | |
| $20.3B | |
| $2.3B | |
| $27.9B | |
| $4.3T | |
| $66.6B | |
| $239.3B | |
| $1.3B | |
| $102.3B | |
| $23.3B | |
| $1.9B | |
| $16.3B | |
| $26.6B | |
| $32.9B | |
| $382.9B | |
| $188.5B | |
| $28.6B | |
| $3.7T | |
| $1.4T | |
| $368.0B | |
| $267.9B | |
| $594.1B | |
| $539.2B | |
| $2.2T | |
| $77.0B | |
| $17.3B | |
| $4.4T | |
| $52.1B | |
| $245.7B | |
| $118.1B | |
| $248.0M | |
| $10.0B | |
| $164.7B | |
| $12.3B | |
| $14.1B | |
| $47.4B | |
| $24.5B | |
| $2.6B | |
| $4.4B | |
| $46.3B | |
| $78.3B | |
| $87.0B | |
| $35.8B | |
| $16.0B | |
| $11.3B | |
| $447.0B | |
| $7.0B | |
| $20.8B | |
| $19.4B | |
| $291.0M | |
| $11.0B | |
| $14.6B | |
| $1.6T | |
| $456.0M | |
| $15.8B | |
| $16.9B | |
| $7.0B | |
| $138.8B | |
| $19.9B | |
| $64.0B | |
| $13.5B | |
| $151.0M | |
| $42.1B | |
| $1.1T | |
| $252.0B | |
| $17.3B | |
| $16.6B | |
| $506.6B | |
| $15.3B | |
| $554.1B | |
| $104.9B | |
| $376.5B | |
| $262.0M | |
| $19.7B | |
| $77.3B | |
| $31.4B | |
| $42.8B | |
| $268.2B | |
| $440.9B | |
| $748.9B | |
| $267.7B | |
| $120.8B | |
| $219.6B | |
| $13.0B | |
| $348.9B | |
| $2.1T | |
| $13.1B | |
| $1.1B | |
| $2.3B | |
| $1.0B | |
| $898.0M | |
| $1.8B | |
| $625.0M | |
| $1.1T | |
| $31.2B | |
| $74.0B | |
| $2.0B | |
| $3.5B | |
| $515.5B | |
| $127.5B | |
| $68.1B | |
| $1.7B | |
| $8.7B | |
| $399.0B | |
| $1.7T | |
| $7.0B | |
| $1.5T | |
| $75.3B | |
| $46.7B | |
| $3.5B | |
| $599.1B | |
| $869.6B | |
| $790.7B | |
| $12.8B | |
| $85.4B | |
| $574.2B | |
| $2.0B | |
| $9.0B | |
| $541.0M | |
| $28.2B | |
| $49.8B | |
| $1.0T | |
| $82.6B | |
| $65.0M | |
| $49.8B | |
| $148.7B | |
| $499.0B | |
| $3.1T | |
| $26.8T | |
| $77.3B | |
| $92.3B | |
| $1.1B | |
| $96.6B | |
| $449.1B | |
| $19.5B | |
| $29.3B | |
| $29.9B |