Per Capita Income By State

1— | District of Columbia | $75,253 | |
2— | Massachusetts | $56,284-28.7K (-34%) | |
3▼2 | Connecticut | $54,409-30.6K (-36%) | |
4▼1 | New Jersey | $53,118-25.6K (-33%) | |
5▲5 | Maryland | $51,689-19K (-27%) | |
6— | Washington | $51,493-24.2K (-32%) | |
7— | New Hampshire | $50,867-23.8K (-32%) | |
8— | Colorado | $50,489-23.7K (-32%) | |
9▼5 | New York | $49,520-28.6K (-37%) | |
10▲3 | Virginia | $49,217-19K (-28%) | |
11▼6 | California | $47,977-29.4K (-38%) | |
12▲2 | Minnesota | $46,957-21.1K (-31%) | |
13▲4 | Rhode Island | $45,919-19.5K (-30%) | |
14▼2 | Illinois | $45,104-23.7K (-34%) | |
15▼4 | Alaska | $44,928-24K (-35%) | |
16▲11 | Hawaii | $44,823-16.4K (-27%) | |
17▲4 | Vermont | $44,365-18.8K (-30%) | |
18▲6 | Delaware | $44,219-17.2K (-28%) | |
19▲3 | Oregon | $44,063-18.7K (-30%) | |
20▼2 | Pennsylvania | $43,104-22.1K (-34%) | |
21▼6 | North Dakota | $42,474-23.7K (-36%) | |
22▲7 | Maine | $42,035-17.4K (-29%) | |
23▲3 | Wisconsin | $42,019-19.2K (-31%) | |
24▼5 | Florida | $41,055-22.5K (-35%) | |
25▼16 | Wyoming | $41,006-30.3K (-43%) | |
26▲13 | Arizona | $40,736-15.9K (-28%) | |
27▼7 | Nebraska | $40,637-22.7K (-36%) | |
28▼3 | Nevada | $39,963-21.3K (-35%) | |
29▲6 | Montana | $39,842-17.9K (-31%) | |
30— | Iowa | $39,728-19.2K (-33%) | |
31▼3 | Kansas | $39,638-20.5K (-34%) | |
32▲4 | North Carolina | $39,616-17.8K (-31%) | |
33▲5 | Michigan | $39,538-17.3K (-30%) | |
34▲3 | Georgia | $39,525-17.6K (-31%) | |
35▼1 | Ohio | $39,455-18.4K (-32%) | |
36▼13 | Texas | $39,446-22.5K (-36%) | |
37▼4 | Utah | $39,240-18.7K (-32%) | |
38▼22 | South Dakota | $38,880-26.9K (-41%) | |
39▲1 | Missouri | $38,497-18.1K (-32%) | |
40▲4 | South Carolina | $37,993-15.3K (-29%) | |
41▼10 | Tennessee | $37,866-20.4K (-35%) | |
42▼10 | Indiana | $37,178-20.8K (-36%) | |
43— | Idaho | $37,169-17.4K (-32%) | |
44▲1 | Kentucky | $34,960-17.1K (-33%) | |
45▼4 | Oklahoma | $34,859-20.1K (-37%) | |
46▲2 | Alabama | $34,835-15.8K (-31%) | |
47— | New Mexico | $34,823-16.7K (-32%) | |
48▼6 | Louisiana | $34,211-20.4K (-37%) | |
49▼3 | Arkansas | $33,147-18.6K (-36%) | |
50▼1 | West Virginia | $32,949-16.2K (-33%) | |
51▼1 | Mississippi | $30,529-15.7K (-34%) |
Last updated February 28, 2026
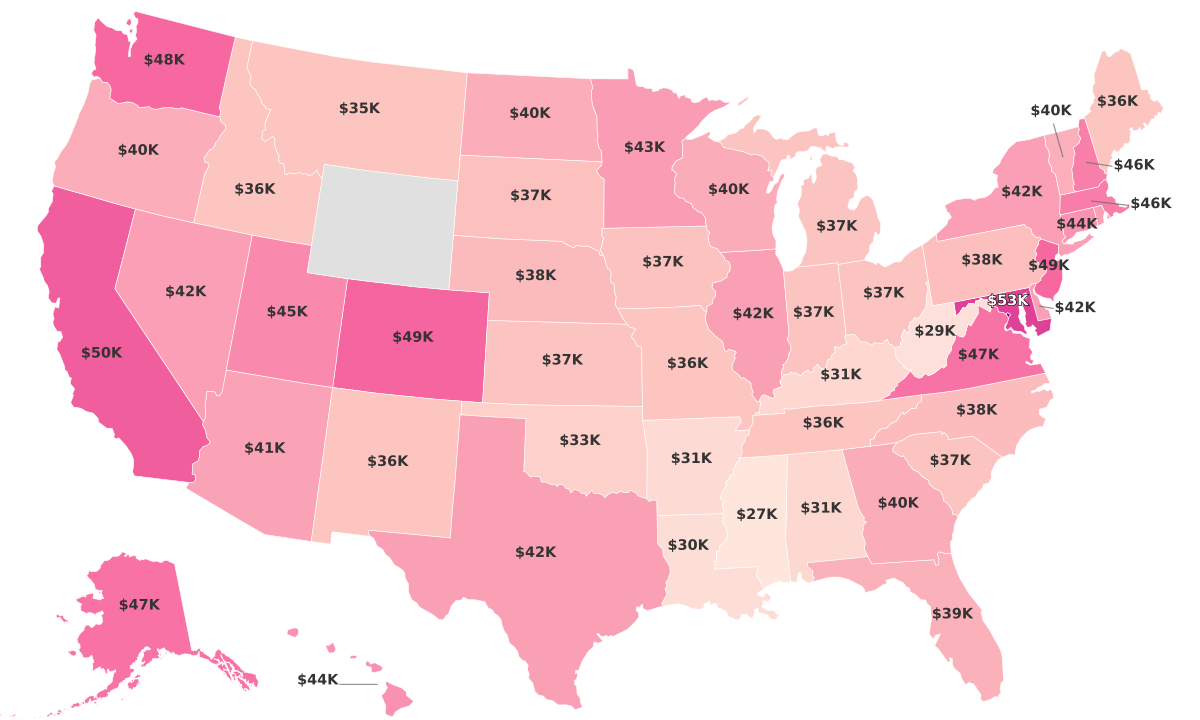
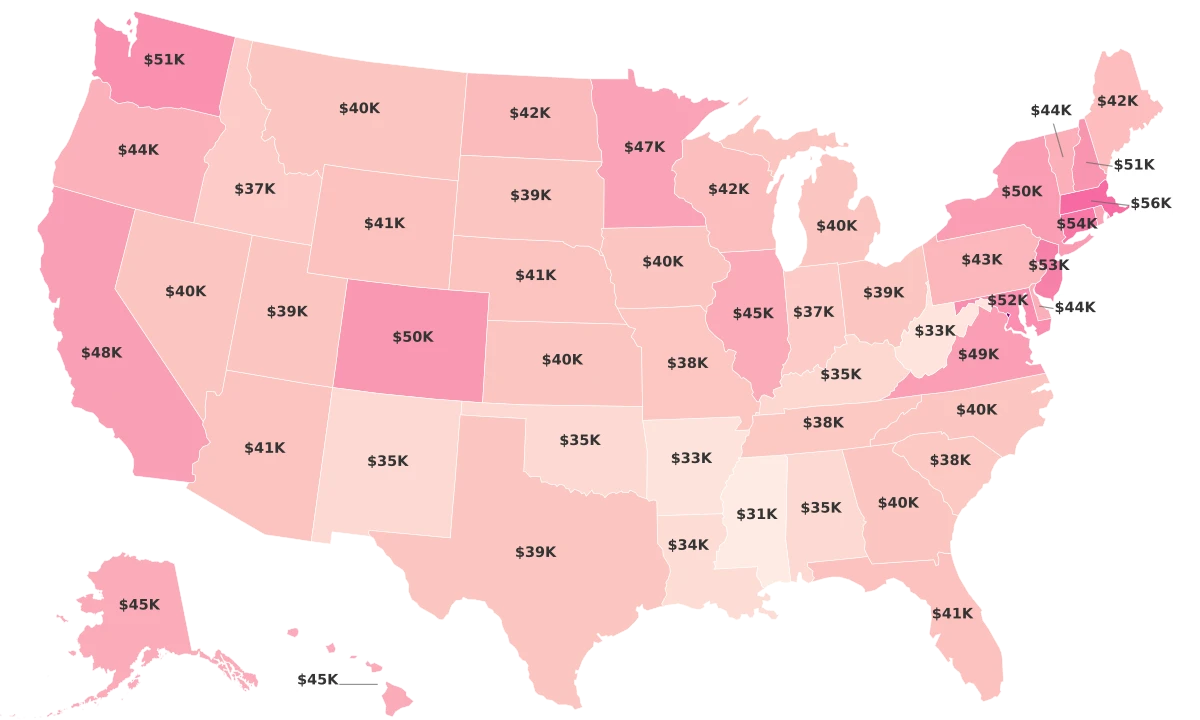
State-by-State Per Capita Income
The measure of any country's economic success is often signified by its per capita income. How much the average person in that nation earns annually provides a clear snapshot of its economy, prevailing wages, wealth distribution, and the standard of living that the populace enjoys. It's imperative to note that per capita income counts every adult and child, regardless of their employment status. As such, it provides a broader yet equally critical perspective on economic performance, quite distinct from other measures like median household income. States in the U.S. exhibit significant disparity in per capita income, heavily influenced by factors such as educational attainment and economic conditions, both of which can vary drastically from one area to another.
- Among all, Connecticut leads the pack with its residents earning an average annual income of $84,972. Massachusetts follows a close second at $84,945, demonstrating one of the tightest races for the top position.
- On the other end of the spectrum, Mississippi has the lowest per capita income at $46,248, significantly lower than the national average.
- States in the east (Connecticut, Massachusetts, New Jersey, and New York) and west coast states like California and Washington generally exhibit higher per capita incomes. This could be due to higher densities of well-paying industries such as technology and finance in these regions.
- In contrast, southern states like West Virginia, Alabama, and Mississippi have lower per capita incomes, which may be attributed to varying economic conditions and diverse industrial landscapes.
All Metrics
| Region ↕ | Income per Capita 2024↕ | Median Household Income 2023↕ | Cost of Living Index 2024↕ | Poverty Rate 2023↕ |
|---|---|---|---|---|
| District of Columbia | $75.3K | |||
| Massachusetts | $56.3K | |||
| Connecticut | $54.4K | |||
| New Jersey | $53.1K | |||
| Maryland | $51.7K | |||
| Washington | $51.5K | |||
| New Hampshire | $50.9K | |||
| Colorado | $50.5K | |||
| New York | $49.5K | |||
| Virginia | $49.2K | |||
| California | $48K | |||
| Minnesota | $47K | |||
| Rhode Island | $45.9K | |||
| Illinois | $45.1K | |||
| Alaska | $44.9K | |||
| Hawaii | $44.8K | |||
| Vermont | $44.4K | |||
| Delaware | $44.2K | |||
| Oregon | $44.1K | |||
| Pennsylvania | $43.1K | |||
| North Dakota | $42.5K | |||
| Maine | $42K | |||
| Wisconsin | $42K | |||
| Florida | $41.1K | |||
| Wyoming | $41K | |||
| Arizona | $40.7K | |||
| Nebraska | $40.6K | |||
| Nevada | $40K | |||
| Montana | $39.8K | |||
| Iowa | $39.7K | |||
| Kansas | $39.6K | |||
| North Carolina | $39.6K | |||
| Michigan | $39.5K | |||
| Georgia | $39.5K | |||
| Ohio | $39.5K | |||
| Texas | $39.4K | |||
| Utah | $39.2K | |||
| South Dakota | $38.9K | |||
| Missouri | $38.5K | |||
| South Carolina | $38K | |||
| Tennessee | $37.9K | |||
| Indiana | $37.2K | |||
| Idaho | $37.2K | |||
| Kentucky | $35K | |||
| Oklahoma | $34.9K | |||
| Alabama | $34.8K | |||
| New Mexico | $34.8K | |||
| Louisiana | $34.2K | |||
| Arkansas | $33.1K | |||
| West Virginia | $32.9K | |||
| Mississippi | $30.5K |
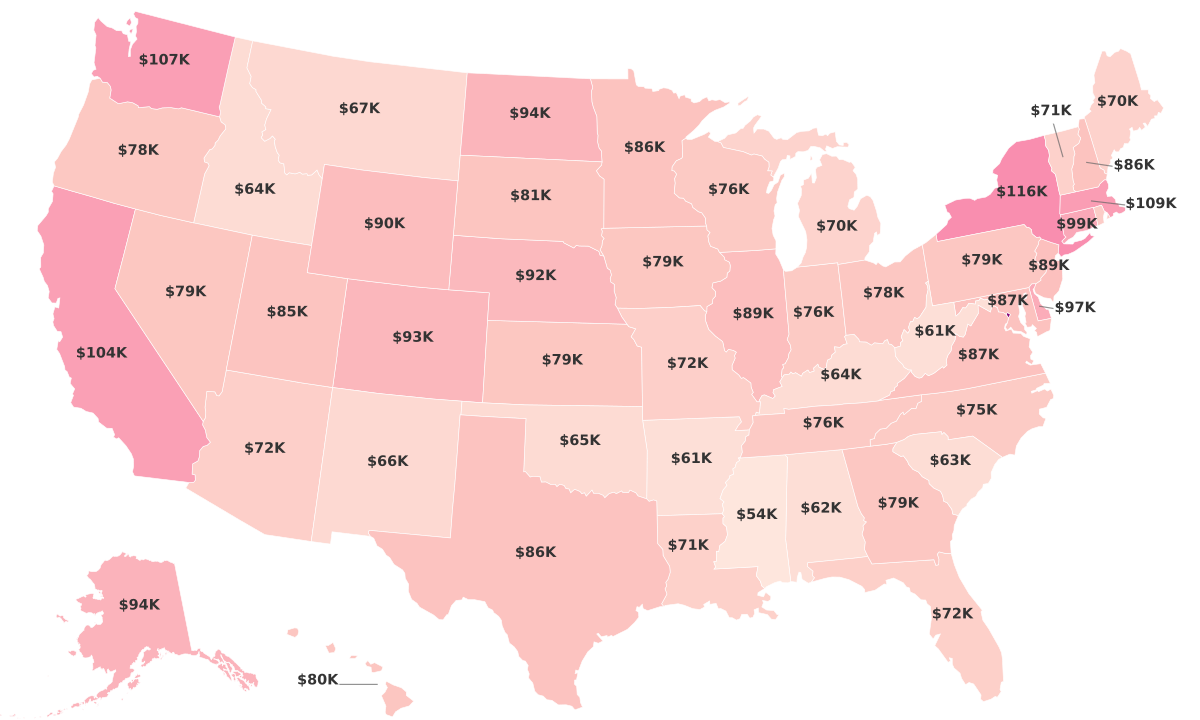
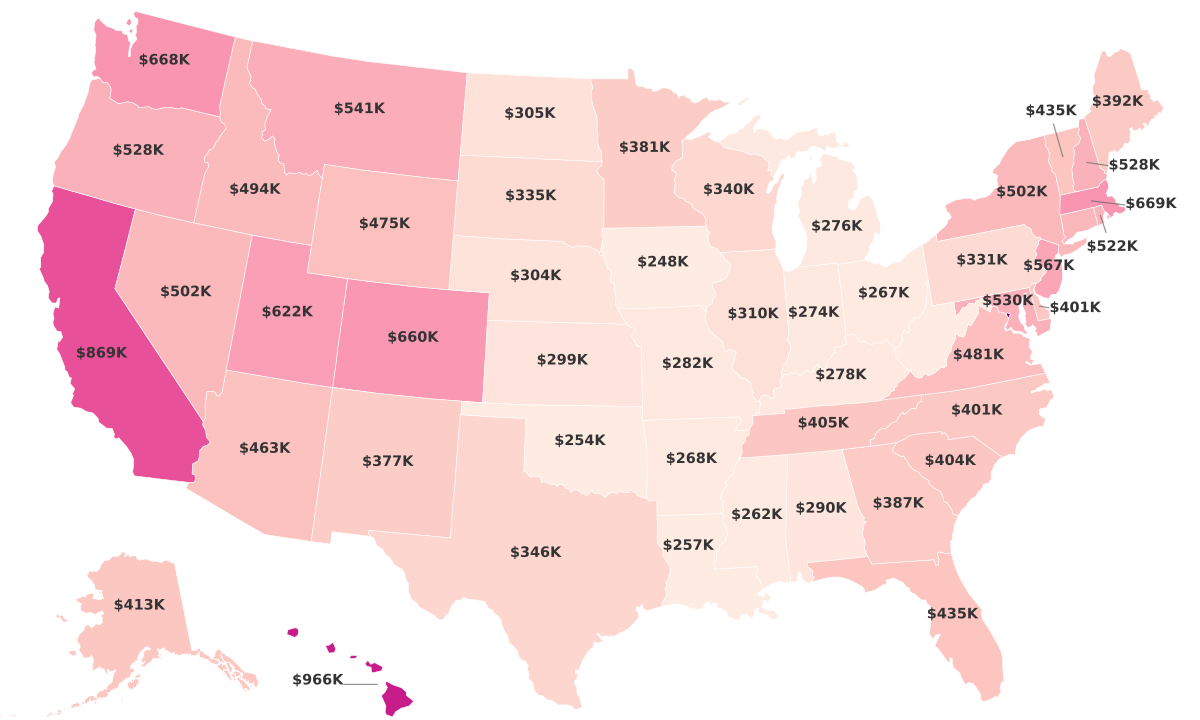
States with the Highest Incomes
Swinging the bat first is Connecticut, ranked highest with an average per capita income of $84,972. A significant chunk of this wealth can be attributed to the high concentration of finance and insurance companies taking root in the state, in addition to an exemplary rate of tertiary education. Following closely behind is Massachusetts with a per capita income of $84,945. This state houses many prestigious universities like Harvard and MIT. Their thriving education sector and the continuous influx of highly educated graduates tend to attract well-paying industries, pushing up the per capita income. Next in the hierarchy is New Jersey, holding third place with a per capita income of $78,700. Sharing a close proximity to New York City and hosting a strong pharmaceutical industry certainly play roles in driving this high income level. New York and California, coming fourth and fifth respectively, are big economic hotspots in the US. Their respective per capita incomes stand at $78,089 and $77,339. Both states boast economic powerhouses such as Wall Street in New York and Silicon Valley in California, host to numerous high-paying industries. Following closely, we arrive at Washington and New Hampshire with per capita incomes of $75,698 and $74,663 respectively. Washington benefits from the tech boom driven by giants like Amazon and Microsoft, while New Hampshire hosts a number of well-performing sectors, from manufacturing to healthcare. Continuing downwards, eighth place goes to Colorado with a per capita income of $74,167. This state benefits from a broad-based economy with key sectors being mining, manufacturing, and tourism. Wyoming, known for its mineral extraction industries, and Maryland with its prominent federal services sector, round off our list with average incomes of $71,342 and $70,730.
States with the Highest Per Capita Incomes:
- Connecticut - $84,972
- Massachusetts - $84,945
- New Jersey - $78,700
- New York - $78,089
- California - $77,339
- Washington - $75,698
- New Hampshire - $74,663
- Colorado - $74,167
- Wyoming - $71,342
- Maryland - $70,730
States with the Lowest Income
Mississippi possesses the lowest per capita income in the U.S. at $46,248, which is markedly less than the national average. West Virginia is the next on the list with a per capita income of $49,169. Alabama sits third from the bottom, reporting a per capita income of $50,637, followed by New Mexico at $51,500 and Arkansas at $51,787. Kentucky's average income per person at $52,109, South Carolina's per capita income of $53,320, Idaho's average income of $54,537, Louisiana's per capita income at $54,622, and Oklahoma's at $54,998, make up the remaining five states with the lowest per capita income. States with the Lowest Income:
- Mississippi - $46,248
- West Virginia - $49,169
- Alabama - $50,637
- New Mexico - $51,500
- Arkansas - $51,787
- Kentucky - $52,109
- South Carolina - $53,320
- Idaho - $54,537
- Louisiana - $54,622
- Oklahoma - $54,998
Sources & Notes
Average total earnings and wages received per person annually.
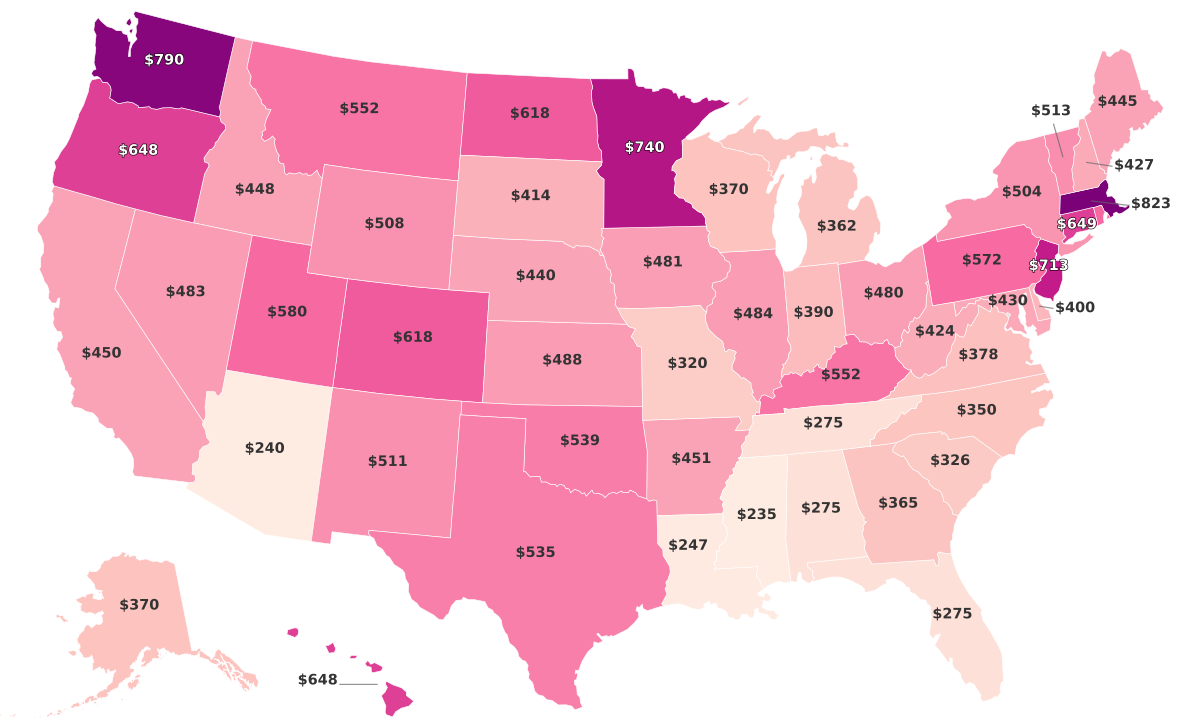
Middle household income value, with half of households earning more and half earning less.
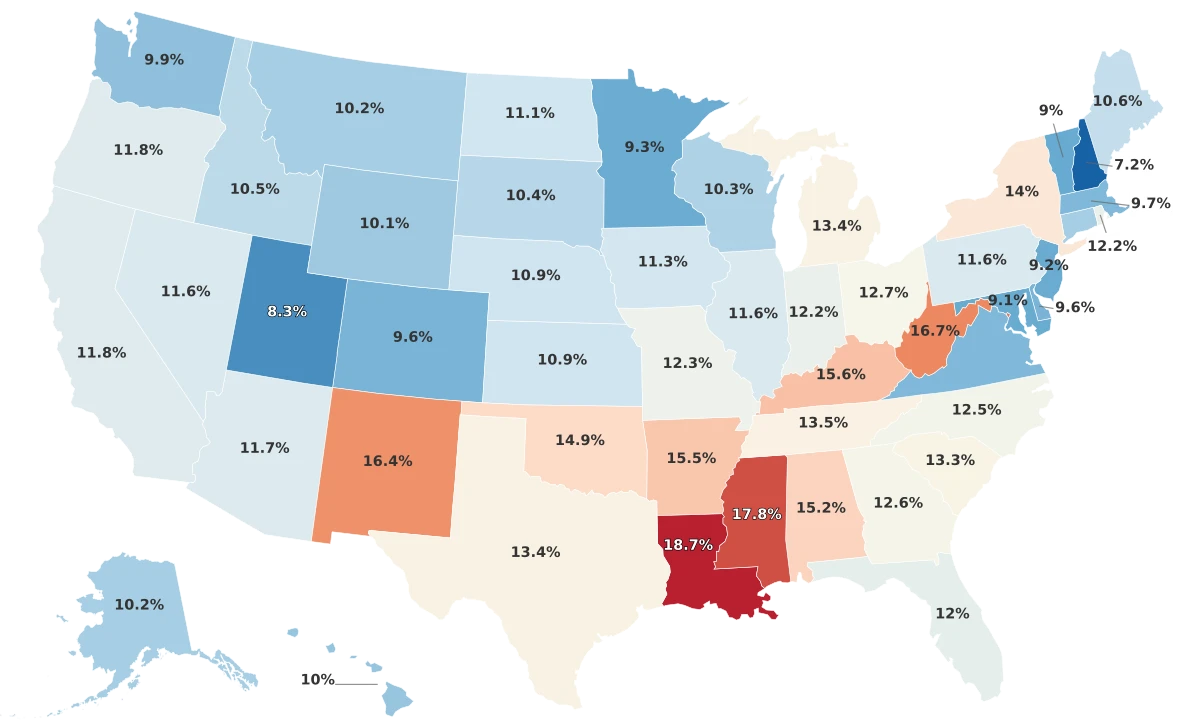
% of the population living below the national poverty line.