Maine
See More
Ranked in U.S.
#49
Last updated November 17, 2024
| 1. | California | 15,380,929 | |
| 2. | Texas | 11,294,257 | |
| 3. | Florida | 5,468,826 | |
| 4. | New York | 3,720,707 | |
| 5. | Arizona | 2,260,690 | |
| 6. | Illinois | 2,190,696 | |
| 7. | New Jersey | 1,815,078 | |
| 8. | Colorado | 1,231,126 | |
| 9. | New Mexico | 1,031,788 | |
| 10. | Georgia | 1,013,057 | |
| 11. | North Carolina | 991,051 | |
| 12. | Pennsylvania | 971,813 | |
| 13. | Washington | 971,522 | |
| 14. | Nevada | 875,798 | |
| 15. | Massachusetts | 828,140 | |
| 16. | Virginia | 810,770 | |
| 17. | Maryland | 619,418 | |
| 18. | Connecticut | 587,212 | |
| 19. | Oregon | 552,279 | |
| 20. | Michigan | 521,203 | |
| 21. | Indiana | 475,475 | |
| 22. | Ohio | 459,939 | |
| 23. | Utah | 446,067 | |
| 24. | Oklahoma | 431,467 | |
| 25. | Wisconsin | 408,267 | |
| 26. | Tennessee | 377,162 | |
| 27. | Kansas | 351,602 | |
| 28. | Minnesota | 307,675 | |
| 29. | South Carolina | 296,897 | |
| 30. | Missouri | 262,677 | |
| 31. | Louisiana | 243,372 | |
| 32. | Arkansas | 229,629 | |
| 33. | Idaho | 222,967 | |
| 34. | Nebraska | 214,952 | |
| 35. | Alabama | 212,951 | |
| 36. | Iowa | 194,407 | |
| 37. | Rhode Island | 168,007 | |
| 38. | Kentucky | 167,949 | |
| 39. | Hawaii | 152,566 | |
| 40. | Mississippi | 94,342 | |
| 41. | Delaware | 91,350 | |
| 42. | Wyoming | 58,854 | |
| 43. | Alaska | 53,059 | |
| 44. | New Hampshire | 52,792 | |
| 45. | Montana | 41,501 | |
| 46. | South Dakota | 36,088 | |
| 47. | North Dakota | 30,325 | |
| 48. | West Virginia | 28,679 | |
| 49. | Maine | 23,143 | |
| 50. | Vermont | 12,518 |
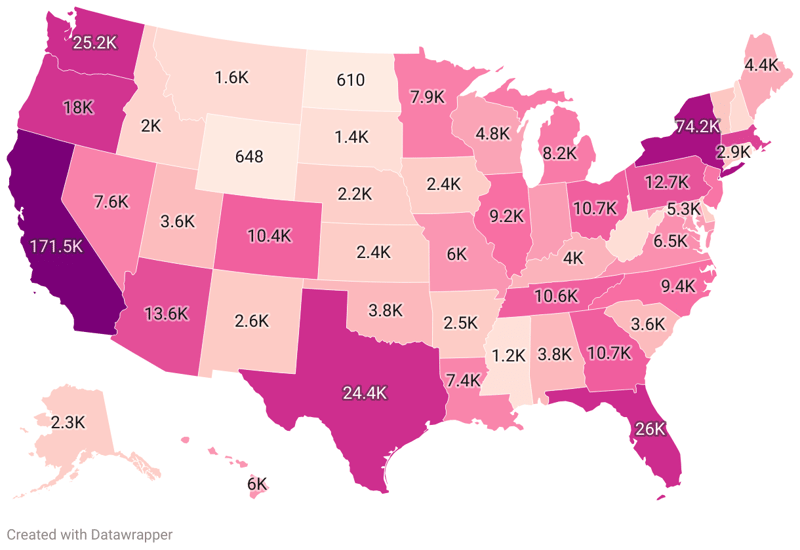
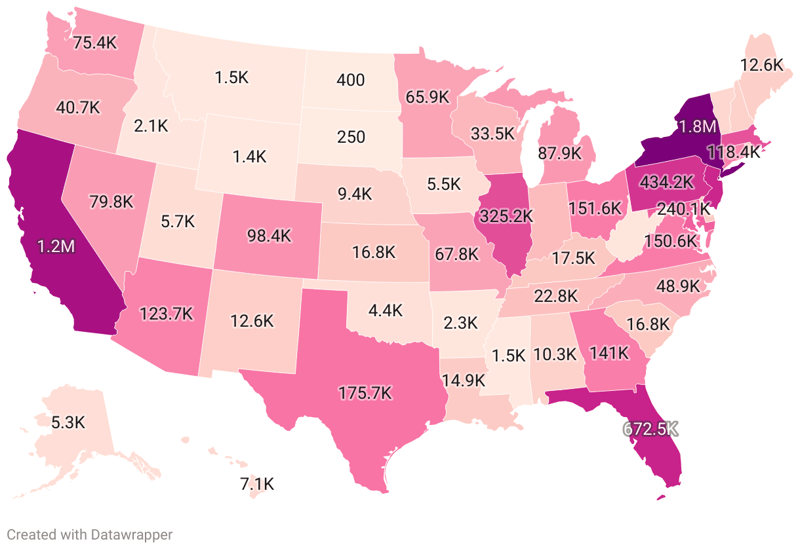
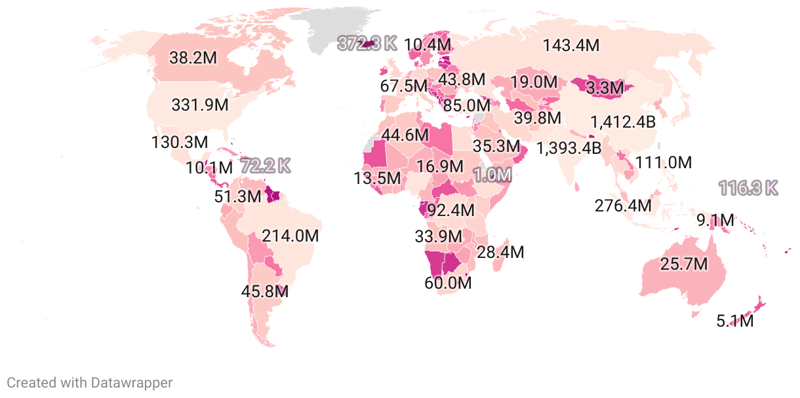
The Hispanic population is a significant and vibrant part of the cultural tapestry of the United States. Currently, the United States is home to more than 60 million Hispanics, comprising nearly 18% of the total population. As both a product of immigration and of births within the U.S., the Hispanic community contributes to an increasingly diverse population, setting the nation apart with its rich traditions, language, and history. Hispanics trace their roots to countries in Latin America or to Spain, and they may or may not be native Spanish speakers. It is essential to note that Hispanic or Latino identity transcends geographical origins and focuses on cultural affiliation. Despite the slowed growth over the past decade, the Hispanic population is still a significant contributor to overall population growth, accounting for 52% of all U.S. population growth between 2010 and 2020.
Topping the list is California, which houses a staggering 15,380,929 Hispanic residents. This population makes up nearly 39% of the state's total population, infusing it with a rich diversity that manifests in its cultural fabric. Coming in second, we have Texas, with a Hispanic community of 11,294,257. Representing roughly 39% of the state's total population, the Hispanic individuals significantly shape its socio-cultural life. In third position, we find Florida, home to 5,468,826 Hispanic citizens. This community amounts to about 26% of the state's overall population. New York ranks fourth on our list, with a Hispanic population of 3,720,707, representing approximately 19% of the state's population. Arizona and Illinois hold the fifth and sixth positions, respectively, housing 2,260,690 and 2,190,696 Hispanic individuals each. New Jersey, Colorado, New Mexico, and Georgia are next, each boasting a prominent Hispanic representation of over a million residents. States with the Largest Hispanic Populations:
Ranked in U.S.
#35
Ranked in U.S.
#43
2,260,690
Ranked in U.S.
#5
Ranked in U.S.
#32
15,380,929
Ranked in U.S.
#1
1,231,126
Ranked in U.S.
#8
Ranked in U.S.
#18
Ranked in U.S.
#41
5,468,826
Ranked in U.S.
#3
1,013,057
Ranked in U.S.
#10
Ranked in U.S.
#39
Ranked in U.S.
#33
2,190,696
Ranked in U.S.
#6
Ranked in U.S.
#21
Ranked in U.S.
#36
Ranked in U.S.
#27
Ranked in U.S.
#38
Ranked in U.S.
#31
Ranked in U.S.
#49
Ranked in U.S.
#17
Ranked in U.S.
#15
Ranked in U.S.
#20
Ranked in U.S.
#28
Ranked in U.S.
#40
Ranked in U.S.
#30
Ranked in U.S.
#45
Ranked in U.S.
#34
Ranked in U.S.
#14
Ranked in U.S.
#44
1,815,078
Ranked in U.S.
#7
1,031,788
Ranked in U.S.
#9
3,720,707
Ranked in U.S.
#4
Ranked in U.S.
#11
Ranked in U.S.
#47
Ranked in U.S.
#22
Ranked in U.S.
#24
Ranked in U.S.
#19
Ranked in U.S.
#12
Ranked in U.S.
#37
Ranked in U.S.
#29
Ranked in U.S.
#46
Ranked in U.S.
#26
11,294,257
Ranked in U.S.
#2
Ranked in U.S.
#23
Ranked in U.S.
#50
Ranked in U.S.
#16
Ranked in U.S.
#13
Ranked in U.S.
#48
Ranked in U.S.
#25
Ranked in U.S.
#42
| Region ↕ | Hispanic and Latino Population↕ |
|---|---|
| 212,951 | |
| 53,059 | |
| 2,260,690 | |
| 229,629 | |
| 15,380,929 | |
| 1,231,126 | |
| 587,212 | |
| 91,350 | |
| 5,468,826 | |
| 1,013,057 | |
| 152,566 | |
| 222,967 | |
| 2,190,696 | |
| 475,475 | |
| 194,407 | |
| 351,602 | |
| 167,949 | |
| 243,372 | |
| 23,143 | |
| 619,418 | |
| 828,140 | |
| 521,203 | |
| 307,675 | |
| 94,342 | |
| 262,677 | |
| 41,501 | |
| 214,952 | |
| 875,798 | |
| 52,792 | |
| 1,815,078 | |
| 1,031,788 | |
| 3,720,707 | |
| 991,051 | |
| 30,325 | |
| 459,939 | |
| 431,467 | |
| 552,279 | |
| 971,813 | |
| 168,007 | |
| 296,897 | |
| 36,088 | |
| 377,162 | |
| 11,294,257 | |
| 446,067 | |
| 12,518 | |
| 810,770 | |
| 971,522 | |
| 28,679 | |
| 408,267 | |
| 58,854 |