Maine
See More
12,550
Ranked in U.S.
#33
Last updated November 24, 2024
| 1. | New York | 1,785,727 | |
| 2. | California | 1,234,540 | |
| 3. | Florida | 672,465 | |
| 4. | New Jersey | 626,220 | |
| 5. | Pennsylvania | 434,165 | |
| 6. | Illinois | 325,160 | |
| 7. | Massachusetts | 301,880 | |
| 8. | Maryland | 240,100 | |
| 9. | Texas | 175,655 | |
| 10. | Ohio | 151,640 | |
| 11. | Virginia | 150,620 | |
| 12. | Georgia | 141,020 | |
| 13. | Arizona | 123,725 | |
| 14. | Connecticut | 118,350 | |
| 15. | Colorado | 98,400 | |
| 16. | Michigan | 87,905 | |
| 17. | Nevada | 79,800 | |
| 18. | Washington | 75,350 | |
| 19. | Missouri | 67,800 | |
| 20. | Minnesota | 65,900 | |
| 21. | North Carolina | 48,935 | |
| 22. | Oregon | 40,650 | |
| 23. | Wisconsin | 33,455 | |
| 24. | Indiana | 26,045 | |
| 25. | Tennessee | 22,800 | |
| 26. | Rhode Island | 18,750 | |
| 27. | Kentucky | 17,500 | |
| 28. | Kansas | 16,825 | |
| 29. | South Carolina | 16,820 | |
| 30. | Delaware | 15,100 | |
| 31. | Louisiana | 14,900 | |
| 32. | New Mexico | 12,625 | |
| 33. | Maine | 12,550 | |
| 34. | Alabama | 10,325 | |
| 35. | New Hampshire | 10,120 | |
| 36. | Nebraska | 9,350 | |
| 37. | Vermont | 7,865 | |
| 38. | Hawaii | 7,100 | |
| 39. | Utah | 5,650 | |
| 40. | Iowa | 5,475 | |
| 41. | Alaska | 5,300 | |
| 42. | Oklahoma | 4,425 | |
| 43. | West Virginia | 2,310 | |
| 44. | Arkansas | 2,250 | |
| 45. | Idaho | 2,125 | |
| 46. | Mississippi | 1,525 | |
| 47. | Montana | 1,495 | |
| 48. | Wyoming | 1,350 | |
| 49. | North Dakota | 400 | |
| 50. | South Dakota | 250 |
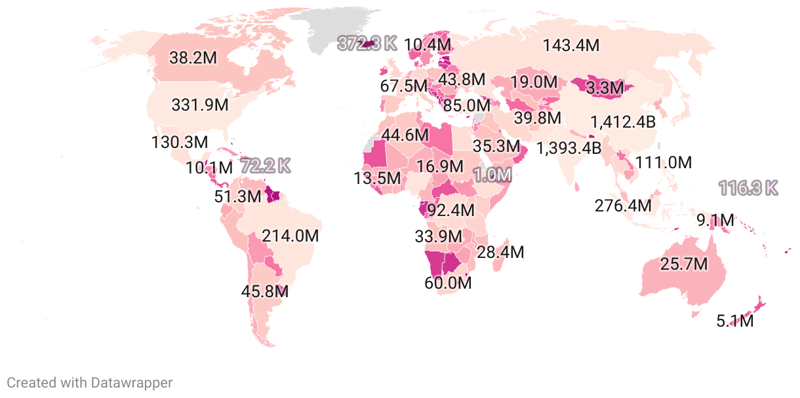
While Jewish Americans only constitute a small fraction of the overall U.S. population, their influence on American culture, social sphere, academic world, and political landscape is significant. With origins tracking back to the Israelites and Hebrews and practicing Judaism, the Jewish people encapsulate a vibrant mix of tradition, faith, and shared history. Their population in the United States ranges from an estimated 5.7 to 10 million people, majority of whom are Ashkenazi Jews—descendants from Jews of Eastern and Central Europe.
The state of New York houses the largest Jewish population in the U.S. at a significant 1,785,727. This isn't surprising considering the state's historical ties to Jewish immigrants from the 20th century. California is second on our list, with a Jewish population of 1,234,540.
Florida stands as the third state with the highest Jewish population, tallying up to 672,465. With its comfortable climate and attractive living conditions, it has become a popular retirement destination for many, including numerous Jewish Americans.
The state of New Jersey, with its proximity to New York, ranks fourth with a Jewish population of 626,220. In the fifth position, we have Pennsylvania, with a robust Jewish community of 434,165 members.
Illinois, Massachusetts, Maryland, Texas, and Ohio comprise the remainder of the top ten states with heightened Jewish populace, each respectively housing 325,160, 301,880, 240,100, 175,655, and 151,640 Jewish individuals.
States with the largest Jewish populations:
10,325
Ranked in U.S.
#34
5,300
Ranked in U.S.
#41
123,725
Ranked in U.S.
#13
2,250
Ranked in U.S.
#44
1,234,540
Ranked in U.S.
#2
98,400
Ranked in U.S.
#15
118,350
Ranked in U.S.
#14
15,100
Ranked in U.S.
#30
672,465
Ranked in U.S.
#3
141,020
Ranked in U.S.
#12
7,100
Ranked in U.S.
#38
2,125
Ranked in U.S.
#45
325,160
Ranked in U.S.
#6
26,045
Ranked in U.S.
#24
5,475
Ranked in U.S.
#40
16,825
Ranked in U.S.
#28
17,500
Ranked in U.S.
#27
14,900
Ranked in U.S.
#31
12,550
Ranked in U.S.
#33
240,100
Ranked in U.S.
#8
301,880
Ranked in U.S.
#7
87,905
Ranked in U.S.
#16
65,900
Ranked in U.S.
#20
1,525
Ranked in U.S.
#46
67,800
Ranked in U.S.
#19
1,495
Ranked in U.S.
#47
9,350
Ranked in U.S.
#36
79,800
Ranked in U.S.
#17
10,120
Ranked in U.S.
#35
626,220
Ranked in U.S.
#4
12,625
Ranked in U.S.
#32
1,785,727
Ranked in U.S.
#1
48,935
Ranked in U.S.
#21
Ranked in U.S.
#49
151,640
Ranked in U.S.
#10
4,425
Ranked in U.S.
#42
40,650
Ranked in U.S.
#22
434,165
Ranked in U.S.
#5
18,750
Ranked in U.S.
#26
16,820
Ranked in U.S.
#29
Ranked in U.S.
#50
22,800
Ranked in U.S.
#25
175,655
Ranked in U.S.
#9
5,650
Ranked in U.S.
#39
7,865
Ranked in U.S.
#37
150,620
Ranked in U.S.
#11
75,350
Ranked in U.S.
#18
2,310
Ranked in U.S.
#43
33,455
Ranked in U.S.
#23
1,350
Ranked in U.S.
#48
| Region ↕ | Jewish Population↕ |
|---|---|
| 10,325 | |
| 5,300 | |
| 123,725 | |
| 2,250 | |
| 1,234,540 | |
| 98,400 | |
| 118,350 | |
| 15,100 | |
| 672,465 | |
| 141,020 | |
| 7,100 | |
| 2,125 | |
| 325,160 | |
| 26,045 | |
| 5,475 | |
| 16,825 | |
| 17,500 | |
| 14,900 | |
| 12,550 | |
| 240,100 | |
| 301,880 | |
| 87,905 | |
| 65,900 | |
| 1,525 | |
| 67,800 | |
| 1,495 | |
| 9,350 | |
| 79,800 | |
| 10,120 | |
| 626,220 | |
| 12,625 | |
| 1,785,727 | |
| 48,935 | |
| 400 | |
| 151,640 | |
| 4,425 | |
| 40,650 | |
| 434,165 | |
| 18,750 | |
| 16,820 | |
| 250 | |
| 22,800 | |
| 175,655 | |
| 5,650 | |
| 7,865 | |
| 150,620 | |
| 75,350 | |
| 2,310 | |
| 33,455 | |
| 1,350 |