Maine
See More
Ranked in U.S.
#32
Last updated September 18, 2024

| 1. | Nevada | 5.4% | |
| 2. | California | 5.1% | |
| 2. | District of Columbia | 5.1% | |
| 4. | New Jersey | 4.8% | |
| 4. | Illinois | 4.8% | |
| 6. | Alaska | 4.5% | |
| 6. | New York | 4.5% | |
| 8. | West Virginia | 4.3% | |
| 8. | Arizona | 4.3% | |
| 8. | Michigan | 4.3% | |
| 8. | Kentucky | 4.3% | |
| 12. | Washington | 4.2% | |
| 12. | Delaware | 4.2% | |
| 14. | Texas | 4% | |
| 14. | New Mexico | 4% | |
| 16. | Connecticut | 3.8% | |
| 17. | Louisiana | 3.7% | |
| 17. | Oregon | 3.7% | |
| 17. | Ohio | 3.7% | |
| 20. | Indiana | 3.6% | |
| 21. | Pennsylvania | 3.5% | |
| 21. | North Carolina | 3.5% | |
| 21. | Tennessee | 3.5% | |
| 24. | Arkansas | 3.4% | |
| 24. | Colorado | 3.4% | |
| 24. | Oklahoma | 3.4% | |
| 24. | Georgia | 3.4% | |
| 28. | Mississippi | 3.3% | |
| 28. | Wisconsin | 3.3% | |
| 28. | Idaho | 3.3% | |
| 28. | Missouri | 3.3% | |
| 32. | Massachusetts | 3.2% | |
| 32. | Montana | 3.2% | |
| 32. | Iowa | 3.2% | |
| 32. | Maine | 3.2% | |
| 32. | Rhode Island | 3.2% | |
| 37. | South Carolina | 3% | |
| 37. | Florida | 3% | |
| 37. | Virginia | 3% | |
| 37. | Wyoming | 3% | |
| 41. | Hawaii | 2.9% | |
| 41. | Minnesota | 2.9% | |
| 43. | Utah | 2.8% | |
| 43. | Kansas | 2.8% | |
| 45. | Alabama | 2.6% | |
| 46. | New Hampshire | 2.5% | |
| 47. | Nebraska | 2.3% | |
| 48. | Vermont | 2.2% | |
| 49. | South Dakota | 2% | |
| 50. | Maryland | 1.9% | |
| 50. | North Dakota | 1.9% |
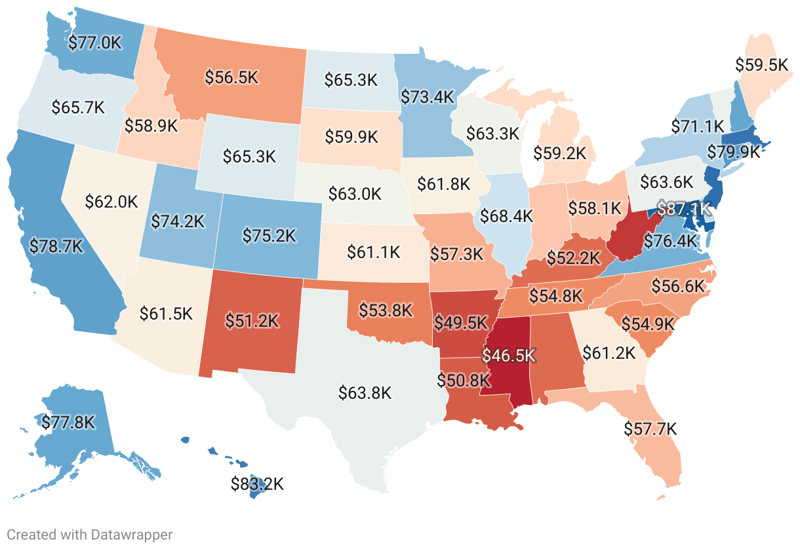
The labor market scenario across different states in the United States offers a wide-ranging multi-dimensional view of the current economic climate in each state, reflecting a variety of factors, including industrial composition, education level, and overall state policies. The Unemployment Rate, reported by the U.S Bureau of Labor Statistics, is a crucial parameter in gauging the health of each state's economy. The unemployment rate is often seen as a measure of the economic health of the country. It influences everything from consumer spending and inflation to socio-political environments within regions. Key findings:
Ranked in U.S.
#45
Ranked in U.S.
#6
Ranked in U.S.
#8
Ranked in U.S.
#24
Ranked in U.S.
#2
Ranked in U.S.
#24
Ranked in U.S.
#16
Ranked in U.S.
#12
Ranked in U.S.
#2
Ranked in U.S.
#37
Ranked in U.S.
#24
Ranked in U.S.
#41
Ranked in U.S.
#28
Ranked in U.S.
#4
Ranked in U.S.
#20
Ranked in U.S.
#32
Ranked in U.S.
#43
Ranked in U.S.
#8
Ranked in U.S.
#17
Ranked in U.S.
#32
Ranked in U.S.
#50
Ranked in U.S.
#32
Ranked in U.S.
#8
Ranked in U.S.
#41
Ranked in U.S.
#28
Ranked in U.S.
#28
Ranked in U.S.
#32
Ranked in U.S.
#47
Ranked in U.S.
#1
Ranked in U.S.
#46
Ranked in U.S.
#4
Ranked in U.S.
#14
Ranked in U.S.
#6
Ranked in U.S.
#21
Ranked in U.S.
#50
Ranked in U.S.
#17
Ranked in U.S.
#24
Ranked in U.S.
#17
Ranked in U.S.
#21
Ranked in U.S.
#32
Ranked in U.S.
#37
Ranked in U.S.
#49
Ranked in U.S.
#21
Ranked in U.S.
#14
Ranked in U.S.
#43
Ranked in U.S.
#48
Ranked in U.S.
#37
Ranked in U.S.
#12
Ranked in U.S.
#8
Ranked in U.S.
#28
Ranked in U.S.
#37
| Region ↕ | Unemployment Rate 2022↕ |
|---|---|
| 2.6% | |
| 4.5% | |
| 4.3% | |
| 3.4% | |
| 5.1% | |
| 3.4% | |
| 3.8% | |
| 4.2% | |
| 5.1% | |
| 3% | |
| 3.4% | |
| 2.9% | |
| 3.3% | |
| 4.8% | |
| 3.6% | |
| 3.2% | |
| 2.8% | |
| 4.3% | |
| 3.7% | |
| 3.2% | |
| 1.9% | |
| 3.2% | |
| 4.3% | |
| 2.9% | |
| 3.3% | |
| 3.3% | |
| 3.2% | |
| 2.3% | |
| 5.4% | |
| 2.5% | |
| 4.8% | |
| 4% | |
| 4.5% | |
| 3.5% | |
| 1.9% | |
| 3.7% | |
| 3.4% | |
| 3.7% | |
| 3.5% | |
| 3.2% | |
| 3% | |
| 2% | |
| 3.5% | |
| 4% | |
| 2.8% | |
| 2.2% | |
| 3% | |
| 4.2% | |
| 4.3% | |
| 3.3% | |
| 3% |