Maine
See More
Ranked in U.S.
#40
Last updated November 24, 2024
| 1. | Texas | 155 | |
| 2. | Kansas | 96 | |
| 3. | Florida | 66 | |
| 4. | Oklahoma | 62 | |
| 5. | Nebraska | 57 | |
| 6. | Illinois | 54 | |
| 7. | Colorado | 53 | |
| 8. | Iowa | 51 | |
| 9. | Minnesota | 45 | |
| 10. | Missouri | 45 | |
| 11. | Alabama | 44 | |
| 12. | Mississippi | 43 | |
| 13. | Arkansas | 39 | |
| 14. | Louisiana | 37 | |
| 15. | South Dakota | 36 | |
| 16. | North Dakota | 32 | |
| 17. | North Carolina | 31 | |
| 18. | Georgia | 30 | |
| 19. | South Carolina | 27 | |
| 20. | Tennessee | 26 | |
| 21. | Wisconsin | 24 | |
| 22. | Indiana | ||
| 23. | Kentucky | 21 | |
| 24. | Ohio | 19 | |
| 25. | Virginia | 18 | |
| 26. | Michigan | 16 | |
| 27. | Pennsylvania | 16 | |
| 28. | Wyoming | 12 | |
| 29. | California | 11 | |
| 30. | New Mexico | 11 | |
| 31. | Maryland | 10 | |
| 32. | Montana | 10 | |
| 33. | New York | 10 | |
| 34. | Arizona | 5 | |
| 35. | Idaho | 5 | |
| 36. | Oregon | 3 | |
| 37. | Utah | 3 | |
| 38. | Washington | 3 | |
| 39. | Connecticut | 2 | |
| 40. | Maine | 2 | |
| 41. | Nevada | 2 | |
| 42. | New Jersey | 2 | |
| 43. | West Virginia | 2 | |
| 44. | Delaware | 1 | |
| 45. | Hawaii | 1 | |
| 46. | Massachusetts | 1 | |
| 47. | New Hampshire | 1 | |
| 48. | Vermont | 1 | |
| 49. | Alaska | 0 | |
| 50. | Rhode Island | 0 |
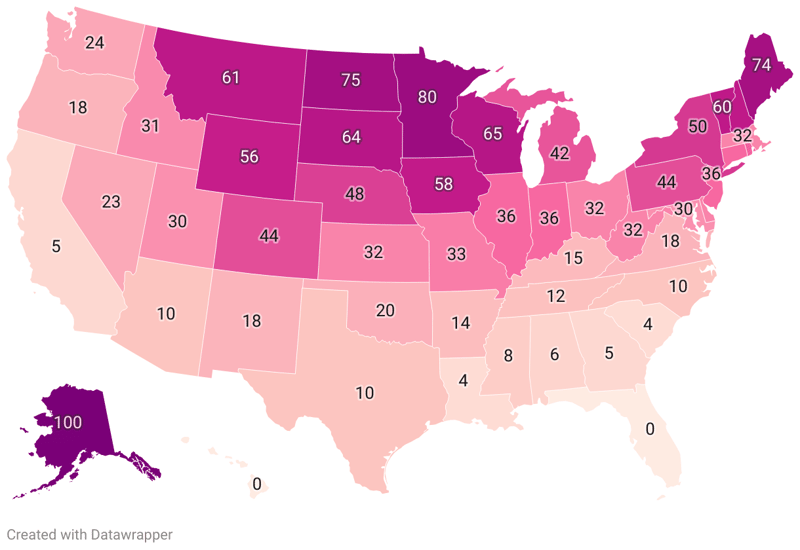
The concept of "Tornado Alley" has fascinated researchers, meteorologists, and disaster preparedness coordinators since it was first coined by U.S. Air Force meteorologists in 1952. Particularly prevalent in the spring months, this infamous strip of land—central to the United States—is subject to numerous cyclones, often producing violent and destructive tornadoes. While traditionally associated with the Midwestern states of Texas, Oklahoma, Kansas, Nebraska, Indiana, Ohio, Missouri, Iowa, and South Dakota, recent data indicates a gradual shift eastward.
The data we've sourced examines the average annual occurrences of tornadoes state-by-state, enabling us to make certain observations about tornado activity across the country.
Key findings from the data include:
Based on average annual tornado occurrences, the state with the most number of tornadoes is Texas, with an astounding average of 155 tornadoes per year. This count is significantly higher than the second and third highest states, Kansas and Florida, with averages of 96.0 and 66.0 tornadoes per year, respectively.
Oklahoma follows close behind Florida with 62.0 tornadoes annually, validating its inclusion in the characteristically tornado-prone region of Tornado Alley. Other traditionally Tornado Alley states, Nebraska and Iowa, rank fifth and eighth respectively, with Nebraska experiencing an average of 57.0 tornadoes and Iowa, 51.0.
Interestingly, Florida, though not geographically part of Tornado Alley, registers the third highest number of average annual tornadoes. This aligns with the recent findings indicating a shift in tornado activity eastward.
Another state not traditionally part of the Tornado Alley, Illinois, records an average of 54.0 tornadoes annually, slightly less than Nebraska but significantly higher than Colorado, which averages 53.0 per year.
The ninth and tenth positions are held by Minnesota and Missouri, each with an average number of 45.0 tornadoes per year.
The top ten states with the highest average annual tornado occurrences are:
Ranked in U.S.
#11
Ranked in U.S.
#49
Ranked in U.S.
#34
Ranked in U.S.
#13
Ranked in U.S.
#29
Ranked in U.S.
#7
Ranked in U.S.
#39
Ranked in U.S.
#44
Ranked in U.S.
#3
Ranked in U.S.
#18
Ranked in U.S.
#45
Ranked in U.S.
#35
Ranked in U.S.
#6
Ranked in U.S.
#22
Ranked in U.S.
#8
Ranked in U.S.
#2
Ranked in U.S.
#23
Ranked in U.S.
#14
Ranked in U.S.
#40
Ranked in U.S.
#31
Ranked in U.S.
#46
Ranked in U.S.
#26
Ranked in U.S.
#9
Ranked in U.S.
#12
Ranked in U.S.
#10
Ranked in U.S.
#32
Ranked in U.S.
#5
Ranked in U.S.
#41
Ranked in U.S.
#47
Ranked in U.S.
#42
Ranked in U.S.
#30
Ranked in U.S.
#33
Ranked in U.S.
#17
Ranked in U.S.
#16
Ranked in U.S.
#24
Ranked in U.S.
#4
Ranked in U.S.
#36
Ranked in U.S.
#27
Ranked in U.S.
#50
Ranked in U.S.
#19
Ranked in U.S.
#15
Ranked in U.S.
#20
Ranked in U.S.
#1
Ranked in U.S.
#37
Ranked in U.S.
#48
Ranked in U.S.
#25
Ranked in U.S.
#38
Ranked in U.S.
#43
Ranked in U.S.
#21
Ranked in U.S.
#28
| Region ↕ | Average Annual Tornados↕ |
|---|---|
| 44 | |
| 0 | |
| 5 | |
| 39 | |
| 11 | |
| 53 | |
| 2 | |
| 1 | |
| 66 | |
| 30 | |
| 1 | |
| 5 | |
| 54 | |
| 22 | |
| 51 | |
| 96 | |
| 21 | |
| 37 | |
| 2 | |
| 10 | |
| 1 | |
| 16 | |
| 45 | |
| 43 | |
| 45 | |
| 10 | |
| 57 | |
| 2 | |
| 1 | |
| 2 | |
| 11 | |
| 10 | |
| 31 | |
| 32 | |
| 19 | |
| 62 | |
| 3 | |
| 16 | |
| 0 | |
| 27 | |
| 36 | |
| 26 | |
| 155 | |
| 3 | |
| 1 | |
| 18 | |
| 3 | |
| 2 | |
| 24 | |
| 12 |