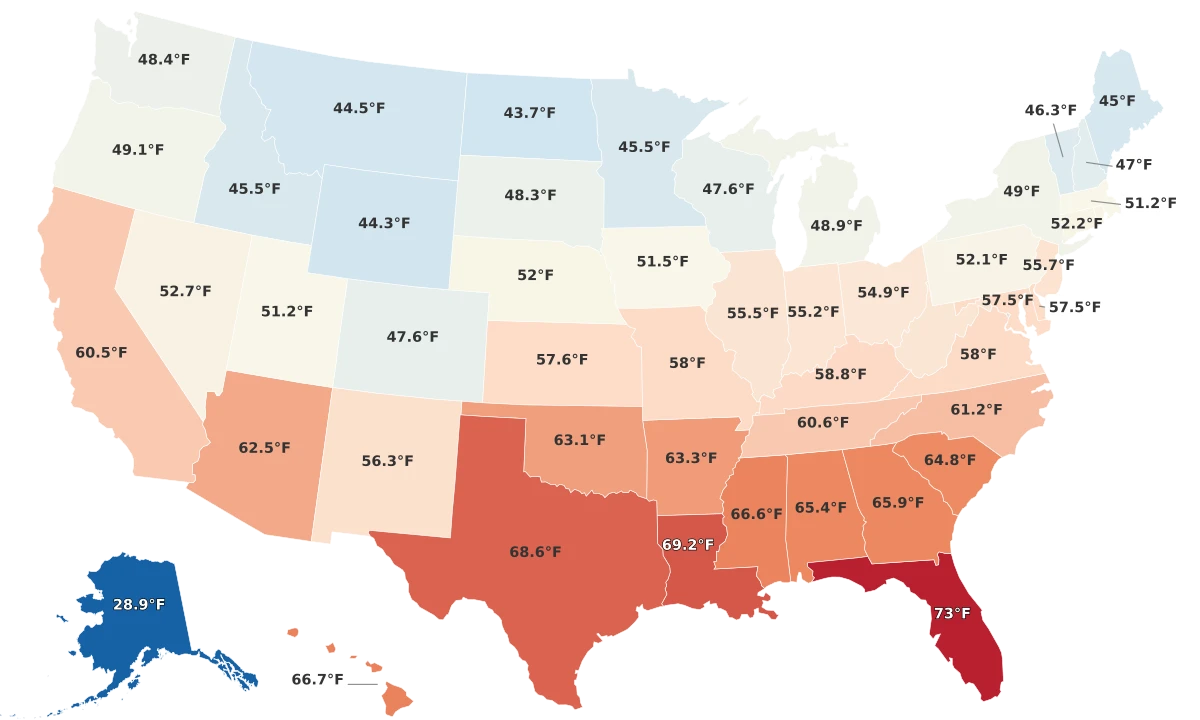
Best Weather By State


1 | Florida | 73°F | |
2 | Louisiana | 69.2°F | |
3 | Texas | 68.6°F | |
4 | Hawaii | 66.7°F | |
5 | Mississippi | 66.6°F | |
6 | Georgia | 65.9°F | |
7 | Alabama | 65.4°F | |
8 | South Carolina | 64.8°F | |
9 | Arkansas | 63.3°F | |
10 | Oklahoma | 63.1°F | |
11 | Arizona | 62.5°F | |
12 | North Carolina | 61.2°F | |
13 | Tennessee | 60.6°F | |
14 | California | 60.5°F | |
15 | Kentucky | 58.8°F | |
16 | Missouri | 58°F | |
16 | Virginia | 58°F | |
18 | Kansas | 57.6°F | |
19 | Delaware | 57.5°F | |
19 | Maryland | 57.5°F | |
21 | New Mexico | 56.3°F | |
22 | New Jersey | 55.7°F | |
23 | Illinois | 55.5°F | |
24 | Indiana | 55.2°F | |
25 | West Virginia | 55.1°F | |
26 | Ohio | 54.9°F | |
27 | Nevada | 52.7°F | |
28 | Rhode Island | 52.3°F | |
29 | Connecticut | 52.2°F | |
30 | Pennsylvania | 52.1°F | |
31 | Nebraska | 52°F | |
32 | Iowa | 51.5°F | |
33 | Utah | 51.2°F | |
33 | Massachusetts | 51.2°F | |
35 | Oregon | 49.1°F | |
36 | New York | 49°F | |
37 | Michigan | 48.9°F | |
38 | Washington | 48.4°F | |
39 | South Dakota | 48.3°F | |
40 | Colorado | 47.6°F | |
40 | Wisconsin | 47.6°F | |
42 | New Hampshire | 47°F | |
43 | Vermont | 46.3°F | |
44 | Minnesota | 45.5°F | |
44 | Idaho | 45.5°F | |
46 | Maine | 45°F | |
47 | Montana | 44.5°F | |
48 | Wyoming | 44.3°F | |
49 | North Dakota | 43.7°F | |
50 | Alaska | 28.9°F |
Last updated March 10, 2026
What "Best Weather" Actually Measures
This ranking combines four climate metrics from NOAA and peer-reviewed climate datasets: annual sunny days, average temperature, total solar radiation (kJ/m²), and relative humidity. The composite favors states that are warm and clear — which is why the overall ranking diverges sharply from any single metric taken alone.
That divergence produces the dataset's most counterintuitive finding: Arizona leads the nation in sunny days (193) but ranks only #11 in average temperature, while Florida has the warmest weather at 73.0°F despite ranking just #24 in sunny days (101). Understanding why requires looking beyond any one number.
All Metrics
| Region ↕ | Average Temperature 2024↕ | # of Sunny Days↕ | Average Annual Sunlight 2019↕ | Average Relative Humidity 2018↕ |
|---|---|---|---|---|
| Florida | 73.0°F | |||
| Louisiana | 69.2°F | |||
| Texas | 68.6°F | |||
| Hawaii | 66.7°F | |||
| Mississippi | 66.6°F | |||
| Georgia | 65.9°F | |||
| Alabama | 65.4°F | |||
| South Carolina | 64.8°F | |||
| Arkansas | 63.3°F | |||
| Oklahoma | 63.1°F | |||
| Arizona | 62.5°F | |||
| North Carolina | 61.2°F | |||
| Tennessee | 60.6°F | |||
| California | 60.5°F | |||
| Kentucky | 58.8°F | |||
| Missouri | 58.0°F | |||
| Virginia | 58.0°F | |||
| Kansas | 57.6°F | |||
| Delaware | 57.5°F | |||
| Maryland | 57.5°F | |||
| New Mexico | 56.3°F | |||
| New Jersey | 55.7°F | |||
| Illinois | 55.5°F | |||
| Indiana | 55.2°F | |||
| West Virginia | 55.1°F | |||
| Ohio | 54.9°F | |||
| Nevada | 52.7°F | |||
| Rhode Island | 52.3°F | |||
| Connecticut | 52.2°F | |||
| Pennsylvania | 52.1°F | |||
| Nebraska | 52.0°F | |||
| Iowa | 51.5°F | |||
| Utah | 51.2°F | |||
| Massachusetts | 51.2°F | |||
| Oregon | 49.1°F | |||
| New York | 49.0°F | |||
| Michigan | 48.9°F | |||
| Washington | 48.4°F | |||
| South Dakota | 48.3°F | |||
| Colorado | 47.6°F | |||
| Wisconsin | 47.6°F | |||
| New Hampshire | 47.0°F | |||
| Vermont | 46.3°F | |||
| Minnesota | 45.5°F | |||
| Idaho | 45.5°F | |||
| Maine | 45.0°F | |||
| Montana | 44.5°F | |||
| Wyoming | 44.3°F | |||
| North Dakota | 43.7°F | |||
| Alaska | 28.9°F |
The 10 States With the Best Weather
| Rank | State | Avg Temp | Sunny Days | Sunlight (kJ/m²) | Humidity |
|---|---|---|---|---|---|
| 1 | Florida | 73.0°F | 101 | 4,859 | 74.5% |
| 2 | Louisiana | 69.2°F | 101 | 4,725 | 74.0% |
| 3 | Texas | 68.6°F | 135 | 5,137 | 64.9% |
| 4 | Hawaii | 66.7°F | 90 | — | 73.3% |
| 5 | Mississippi | 66.6°F | 111 | 4,693 | 73.6% |
| 6 | Georgia | 65.9°F | 112 | 4,661 | 71.1% |
| 7 | Alabama | 65.4°F | 99 | 4,660 | 71.6% |
| 8 | South Carolina | 64.8°F | 115 | 4,624 | 69.1% |
| 9 | Arkansas | 63.3°F | 123 | 4,725 | 70.9% |
| 10 | Oklahoma | 63.1°F | 139 | 4,912 | 64.0% |
Nine of the top 10 are Deep South states — a pattern driven almost entirely by temperature. Hawaii is the outlier at #4 with just 90 sunny days, the fewest of any top-10 state. Its ranking is sustained by thermal consistency: Honolulu's temperature rarely drops below 65°F or exceeds 90°F in any month, a stability no mainland state matches.
The "Sunshine State" paradox anchors this list. Florida generates 70 to 100 thunderstorm days annually — more than any other state — as Atlantic and Gulf sea breezes collide over its flat interior each afternoon from May through October. Those convective storms erase clear-sky hours even though the sun dominates mornings and post-storm evenings, which is why Tampa logs only 101 fully clear days despite 66% possible sunshine hours.
X-axis: Number of Sunny Days per year. Y-axis: Average Annual Temperature (°F). The scatter reveals that sunny days and warmth are only moderately correlated — hot Gulf Coast states cluster in the upper-left (warm but fewer clear days), while arid Western states spread across the lower-right (sunny but cooler).
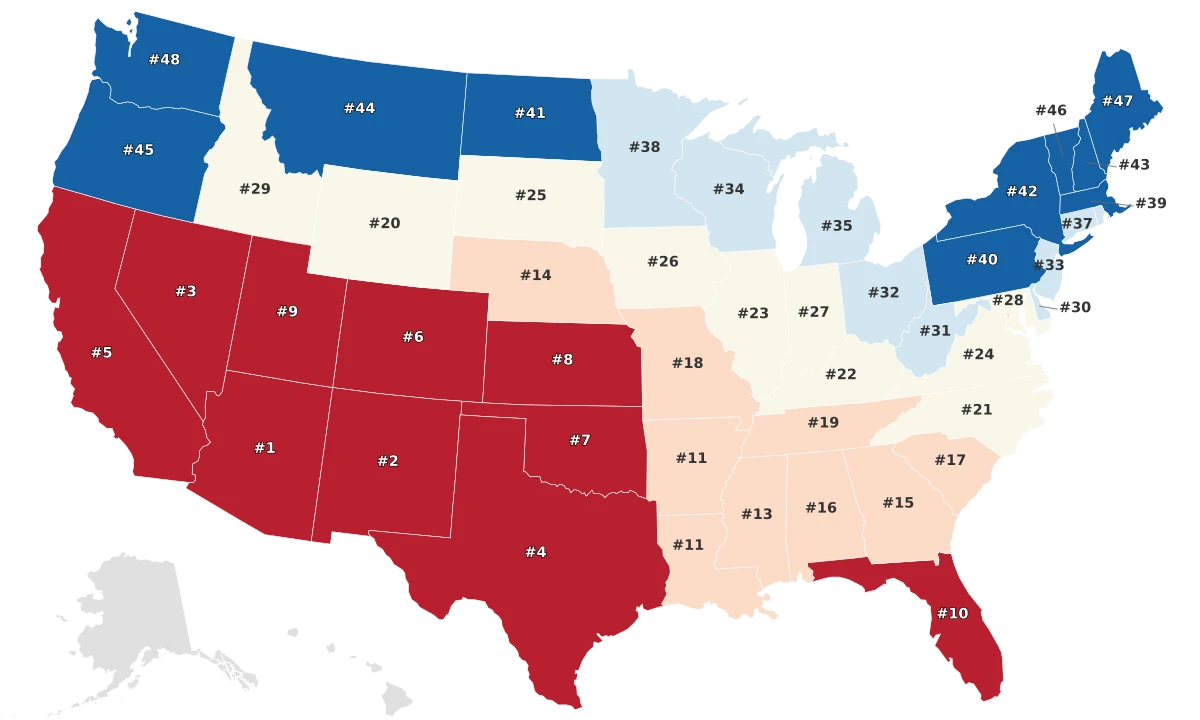
The Sunniest vs. the Cloudiest
| Rank | Sunniest State | Days | Cloudiest State | Days |
|---|---|---|---|---|
| 1 | Arizona | 193 | Washington | 58 |
| 2 | New Mexico | 167 | Vermont | 58 |
| 3 | Nevada | 158 | West Virginia | 60 |
| 4 | California | 146 | Alaska | 61 |
| 5 | Oklahoma | 139 | New York | 63 |
| 6 | Colorado | 136 | Oregon | 68 |
| 7 | Texas | 135 | Michigan | 71 |
| 8 | Kansas | 128 | Ohio | 72 |
| 9 | Utah | 125 | Montana | 82 |
| 10 | Arkansas | 123 | Connecticut | 82 |
The sunniest states are almost exclusively in the arid West and Southern Plains, where low humidity (38–65%) allows persistent high-pressure systems to dominate. Arizona's 193 clear days are driven by the Sonoran Desert's subtropical ridge — a semi-permanent high-pressure zone that blocks Pacific moisture for most of the year.
The cloudiest corridor runs from the Pacific Northwest through the Great Lakes. Washington and Oregon sit beneath a persistent marine layer fed by Pacific moisture that the Cascade Range traps on the western slopes, giving Seattle just 58 clear days and 226 cloudy days per year. The Great Lakes states — Ohio (72), Michigan (71), and Wisconsin (89) — face a similar mechanism: lake-effect moisture generates low stratus cloud decks from November through March that suppress clear-sky counts well below the national average of 103.
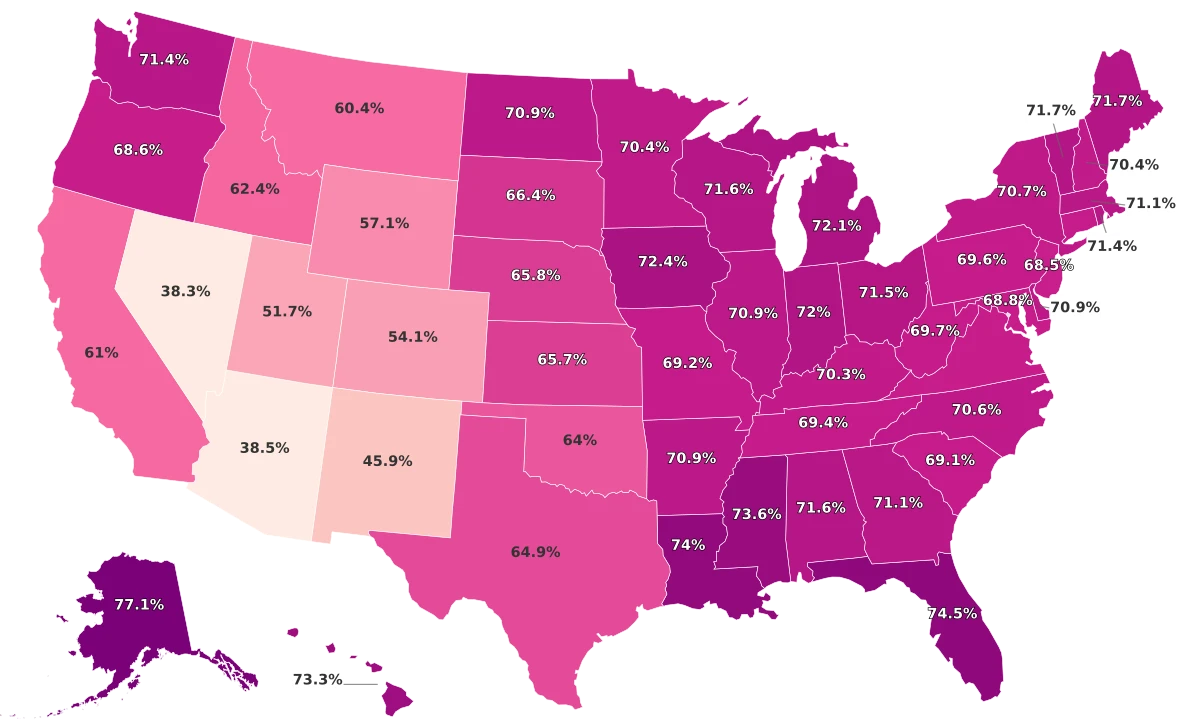
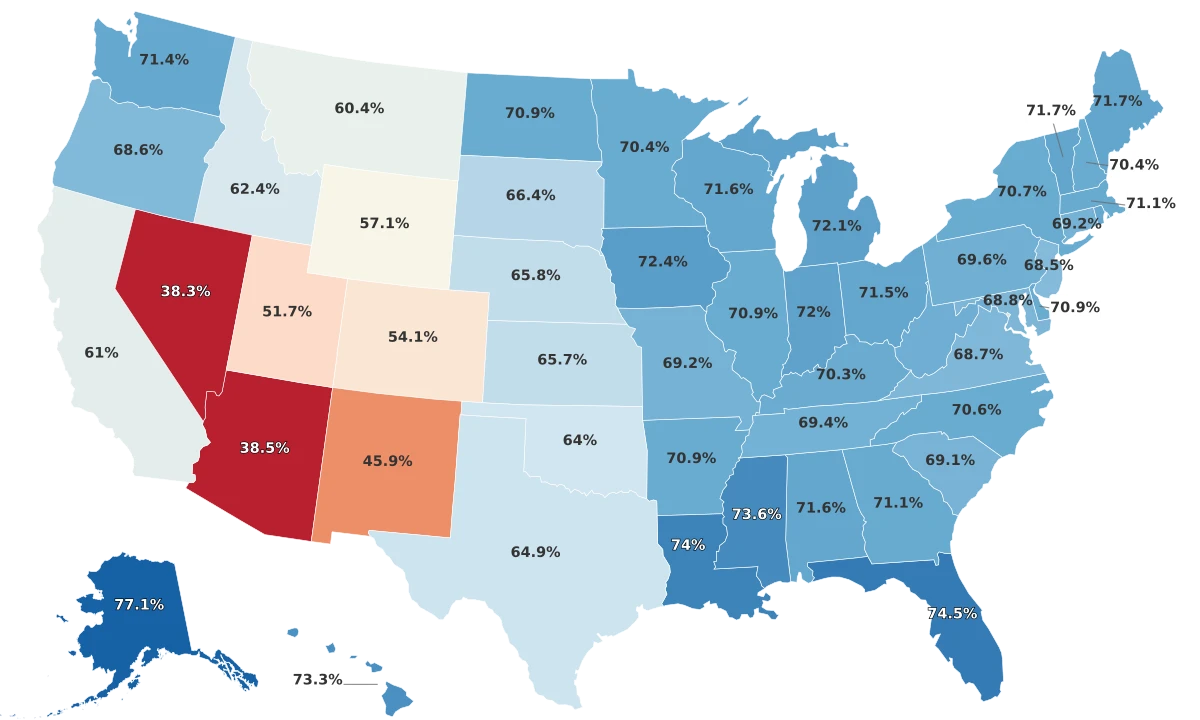
The Humidity Inversion
The most counterintuitive finding in the dataset is that Alaska — not Florida — is the most humid state at 77.1% relative humidity. This is a function of temperature, not moisture content. Cold air has a far smaller capacity to hold water vapor, so even trace amounts push relative humidity readings toward saturation. Alaska's average dew point is actually the lowest in the nation — the air feels dry but reads as humid because the saturation denominator is so small.
By contrast, the states that feel most humid — Florida (74.5%), Louisiana (74.0%), Mississippi (73.6%) — rank 2nd through 4th because their warm air contains vastly more actual water vapor at the same relative percentages. Meanwhile, the driest states mirror the sunniest: Nevada (38.3%), Arizona (38.5%), and New Mexico (45.9%) — all desert climates where low moisture and clear skies reinforce each other.
X-axis: Number of Sunny Days per year. Y-axis: Average Relative Humidity (%). The inverse clustering confirms that dry air and clear skies are structurally linked — the arid Southwest anchors the bottom-right (sunny and dry), while the Great Lakes and Gulf Coast states occupy the upper-left (humid and cloudy).
Sources & Notes
Average annual temperature.
The Annual Sunlight the region receives in kJ/m².
% of moisture present in the air.