Last updated February 28, 2026
Introduction
In the United States, the issue of poverty is a multi-faceted one, entrenched in a complex interplay of systemic variables. From job loss to limited access to quality education, inheritance of poverty to systematic exclusion, numerous factors contribute to this pressing issue. Many living below the poverty line struggle to secure fundamental needs such as housing, food, and basic hygiene items.
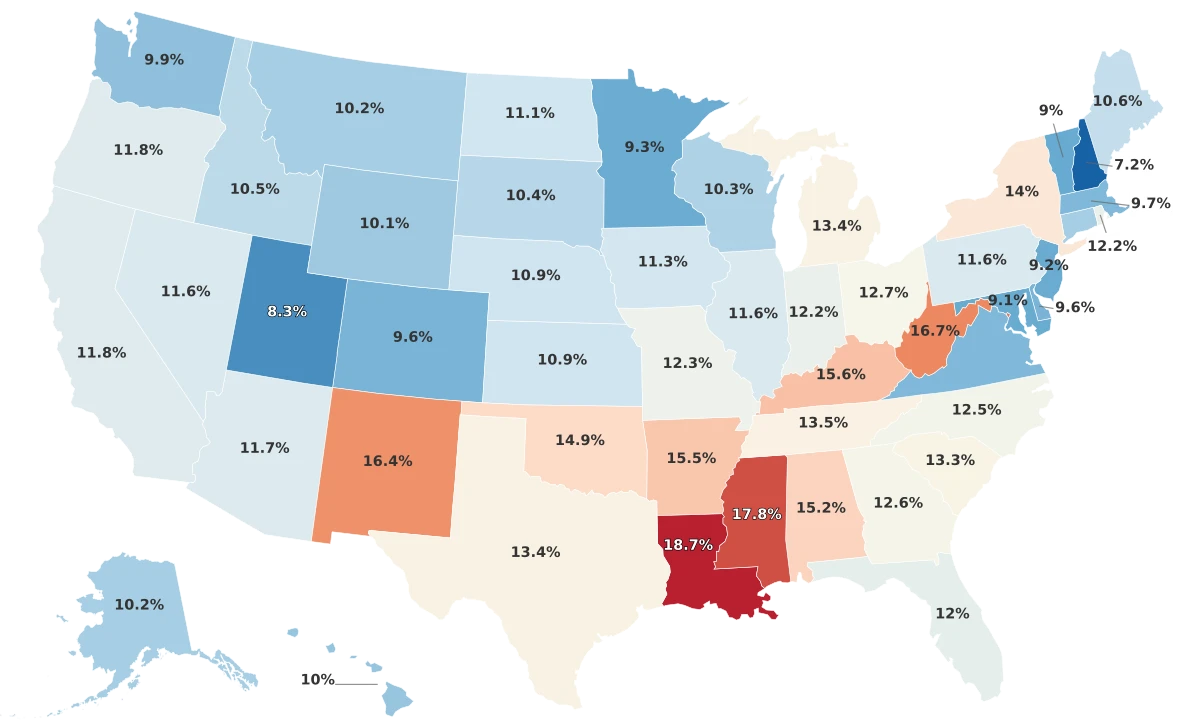
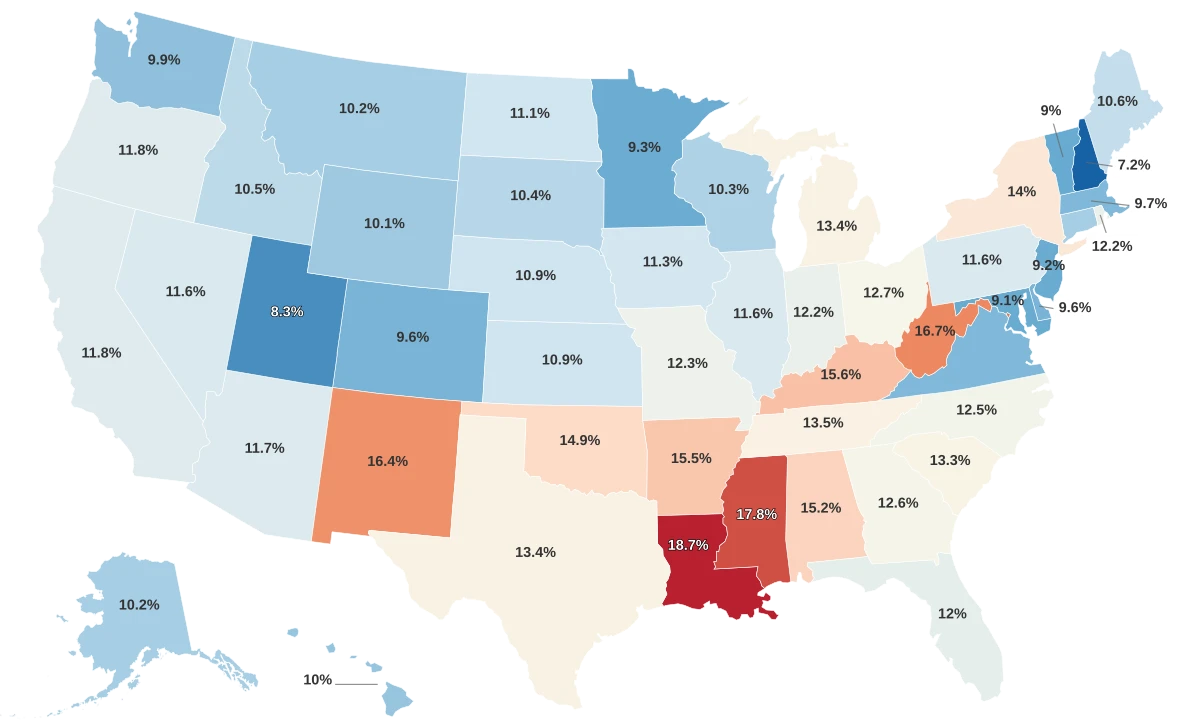
- Mississippi, Louisiana, and New Mexico hold the highest poverty rates, with 19.3%, 18.6%, and 18.1% respectively. This underscores a struggle with persistent and deep-seated poverty in these areas.
- States with the lowest poverty rates include Maryland, Utah, and New Hampshire, with 8.6%, 8.3%, and 6.9% respectively, hinting at broader access to resources or a better performance in poverty-reducing measures.
- Regions with high poverty rates are concentrated in the South, indicating that these areas face greater systemic obstacles to escape poverty, possibly due to lower salaries, higher unemployment rates, or limited access to quality education and healthcare.
- States like California, New York, and Michigan, despite having thriving metropolises, still have poverty rates higher than 12%, pointing out the prevalence of urban poverty.
All Metrics
| Region ↕ | Poverty Rate 2023↕ | Median Household Income 2023↕ | Snap Recipients 2025↕ | Homeless Rate 2024↕ |
|---|---|---|---|---|
| Louisiana | 18.7% | |||
| Mississippi | 17.8% | |||
| District of Columbia | 17.3% | |||
| West Virginia | 16.7% | |||
| New Mexico | 16.4% | |||
| Kentucky | 15.6% | |||
| Arkansas | 15.5% | |||
| Alabama | 15.2% | |||
| Oklahoma | 14.9% | |||
| New York | 14.0% | |||
| Tennessee | 13.5% | |||
| Texas | 13.4% | |||
| Michigan | 13.4% | |||
| South Carolina | 13.3% | |||
| Ohio | 12.7% | |||
| Georgia | 12.6% | |||
| North Carolina | 12.5% | |||
| Missouri | 12.3% | |||
| Indiana | 12.2% | |||
| Rhode Island | 12.2% | |||
| Florida | 12.0% | |||
| Oregon | 11.8% | |||
| California | 11.8% | |||
| Arizona | 11.7% | |||
| Nevada | 11.6% | |||
| Pennsylvania | 11.6% | |||
| Illinois | 11.6% | |||
| Iowa | 11.3% | |||
| North Dakota | 11.1% | |||
| Nebraska | 10.9% | |||
| Kansas | 10.9% | |||
| Maine | 10.6% | |||
| Idaho | 10.5% | |||
| South Dakota | 10.4% | |||
| Wisconsin | 10.3% | |||
| Alaska | 10.2% | |||
| Montana | 10.2% | |||
| Connecticut | 10.2% | |||
| Wyoming | 10.1% | |||
| Hawaii | 10.0% | |||
| Washington | 9.9% | |||
| Virginia | 9.7% | |||
| Massachusetts | 9.7% | |||
| Delaware | 9.6% | |||
| Colorado | 9.6% | |||
| Minnesota | 9.3% | |||
| New Jersey | 9.2% | |||
| Maryland | 9.1% | |||
| Vermont | 9.0% | |||
| Utah | 8.3% | |||
| New Hampshire | 7.2% |
States with the Most Poverty
Leading the pack is Mississippi, where 19.3% of residents live below the poverty line. Despite its rich cultural heritage and natural resources, the state still struggles with high rates of poverty, likely owing to a lack of quality job opportunities and persistent economic distress. Louisiana comes in a close second with a poverty rate of 18.6%, linked to long-standing economic struggles and, more recently, the devastating effects of natural disasters. Just behind is New Mexico at 18.1%, grappling with issues of educational access and job disparity, which perpetuate an ongoing cycle of poverty. West Virginia and Kentucky also have a noticeable prevalence of poverty, witnessing 17% and 15.9% poverty rates, respectively. They are followed by Arkansas at 15.3%, Alabama at 15%, and Oklahoma at 14.5%. Complications around access to education, decent jobs, and social inequality may contribute to these high rates. Lastly, Tennessee and South Carolina wrap up the top ten list with 13.5% poverty rates each. While strides have been made to decrease poverty in these states, a significant portion of their population still struggles for a basic living. States with Highest Poverty Rates:
- Mississippi - 19.3%
- Louisiana - 18.6%
- New Mexico - 18.1%
- West Virginia - 17.0%
- Kentucky - 15.9%
- Arkansas - 15.3%
- Alabama - 15.0%
- Oklahoma - 14.5%
- Tennessee - 13.5%
- South Carolina - 13.5%
States with the Least Poverty
New Hampshire tops the list with the least poverty rate of 6.9%. Known for its high quality of life and strong economy, New Hampshire provides its residents with ample employment opportunities and resources. Utah follows closely, with a poverty rate of 8.3%. The state's diverse economy and high employment rate play a significant role in keeping its poverty levels low. Maryland, with an 8.6% poverty rate, ranks third among states with the least poverty. The state benefits from a highly educated workforce and close proximity to Washington D.C., offering numerous government job opportunities. Hawaii and Minnesota, both with an 8.9% poverty rate, stand fourth and fifth respectively. These states offer robust social services and have economies bolstered by tourism and diverse industries. New Jersey, with a 9.1% poverty rate, ranks sixth due to its high per capita income and employment opportunities in sectors such as pharmaceuticals, finance, and telecommunications. Colorado and Connecticut each have a poverty rate of 9.3%, reflective of their robust economies, driven by industries like technology, manufacturing, and financial services. Massachusetts, with a poverty rate of 9.4%, benefits from a strong economy based on higher education, healthcare, and technology. Virginia rounds off our list with a 9.5% poverty rate, benefitting from a diverse economy with a strong employment base in government services, defense, and information technology. States with the Least Poverty:
- New Hampshire - 6.9%
- Utah - 8.3%
- Maryland - 8.6%
- Hawaii - 8.9%
- Minnesota - 8.9%
- New Jersey - 9.1%
- Colorado - 9.3%
- Connecticut - 9.3%
- Massachusetts - 9.4%
- Virginia - 9.5%
Sources & Notes
% of the population living below the national poverty line.
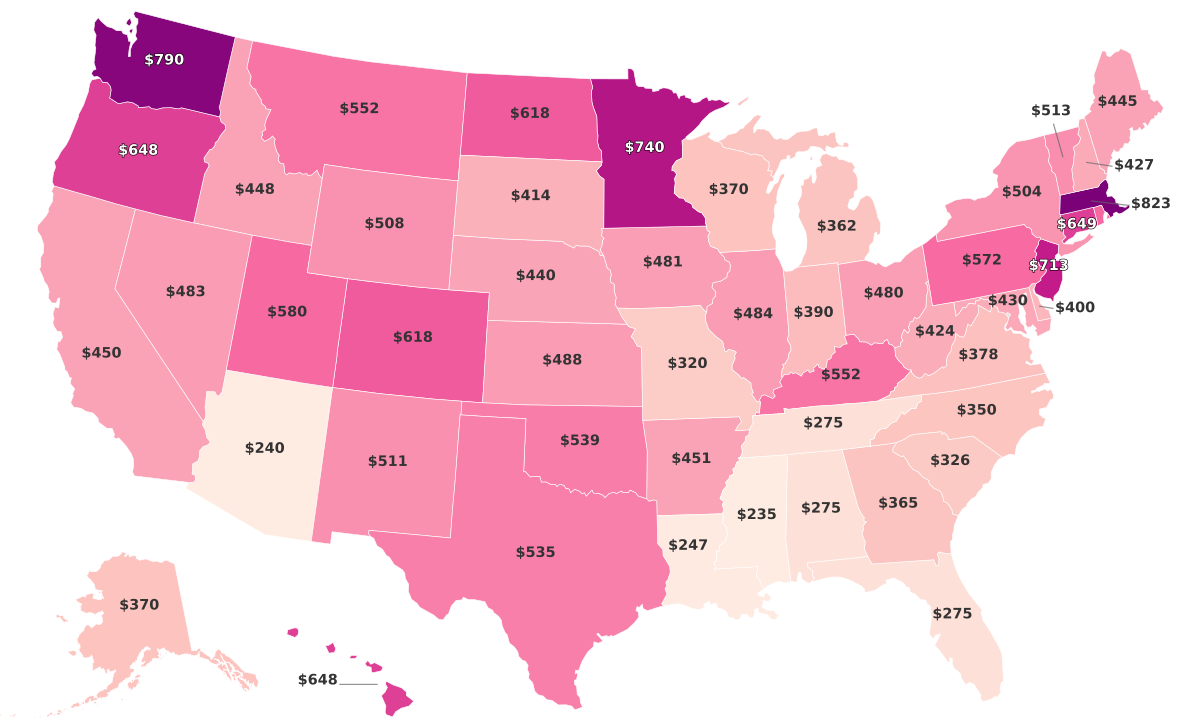
Middle household income value, with half of households earning more and half earning less.
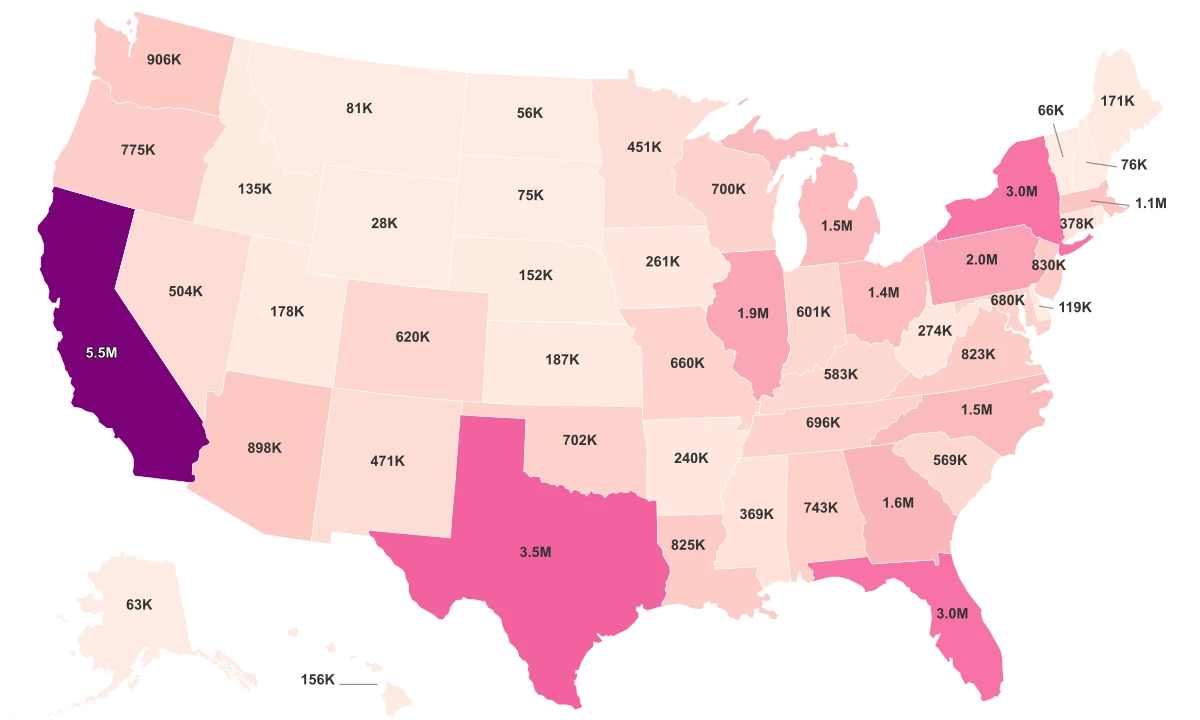
Number of people receiving Supplemental Nutrition Assistance Program (SNAP) benefits.
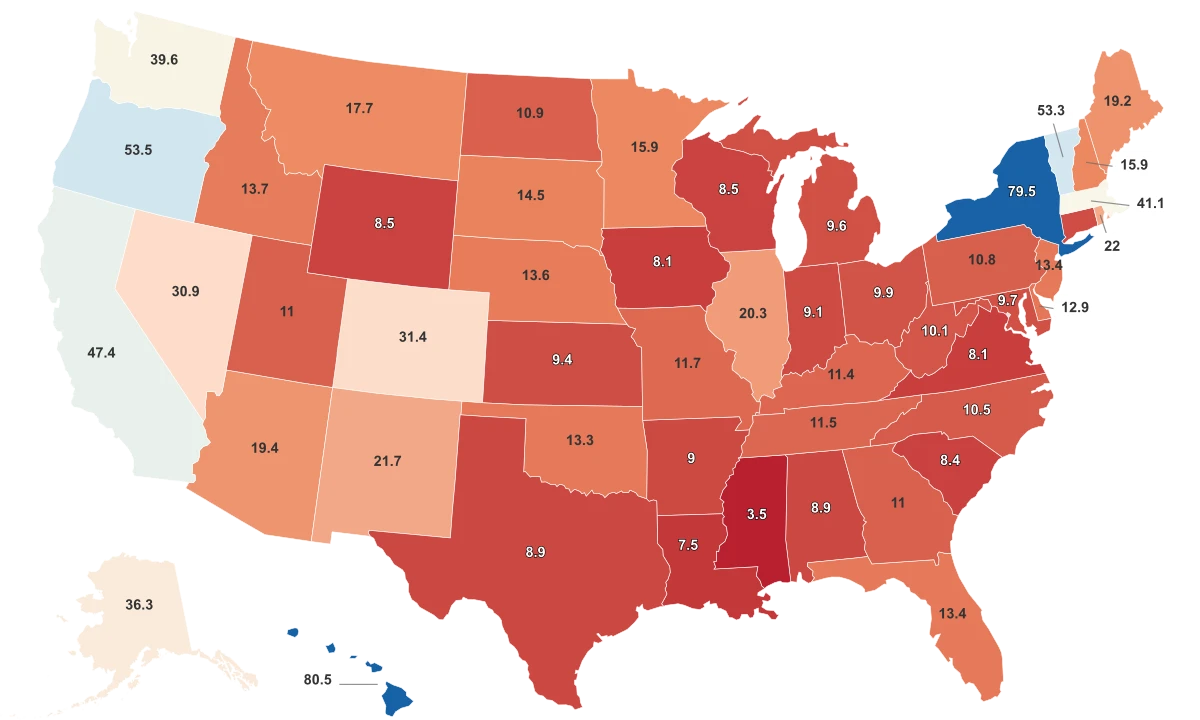
Rate of homelessness per 10,000 people.