Maine
See More
$37,190
Ranked in U.S.
#13
Last updated September 18, 2024
| 1. | Hawaii | $45,739 | |
| 2. | New York | $45,739 | |
| 3. | Massachusetts | $45,510 | |
| 4. | California | $45,386 | |
| 5. | New Jersey | $42,786 | |
| 6. | Maryland | $41,059 | |
| 7. | Oregon | $40,581 | |
| 8. | Virginia | $40,352 | |
| 9. | Colorado | $39,853 | |
| 10. | Connecticut | $39,520 | |
| 11. | Washington | $38,563 | |
| 12. | Illinois | $37,773 | |
| 13. | Maine | $37,190 | |
| 14. | Vermont | $37,045 | |
| 15. | Rhode Island | $37,024 | |
| 16. | Delaware | $36,899 | |
| 17. | Minnesota | $36,899 | |
| 18. | Georgia | $36,691 | |
| 19. | South Carolina | $36,338 | |
| 20. | Arizona | $36,254 | |
| 21. | New Hampshire | $36,026 | |
| 22. | Florida | $35,859 | |
| 23. | North Carolina | $35,651 | |
| 24. | Utah | $35,318 | |
| 25. | Alaska | $34,778 | |
| 26. | Pennsylvania | $34,674 | |
| 27. | Nebraska | $34,528 | |
| 28. | Texas | $34,133 | |
| 29. | Wisconsin | $34,112 | |
| 30. | Kansas | $34,070 | |
| 31. | Michigan | $34,029 | |
| 32. | Montana | $33,946 | |
| 33. | Missouri | $33,883 | |
| 34. | New Mexico | $33,800 | |
| 35. | Nevada | $33,779 | |
| 36. | Iowa | $33,654 | |
| 37. | Idaho | $33,613 | |
| 38. | Louisiana | $33,592 | |
| 39. | Alabama | $33,093 | |
| 40. | Indiana | $32,843 | |
| 41. | Oklahoma | $32,760 | |
| 42. | Mississippi | $32,573 | |
| 43. | Ohio | $32,469 | |
| 44. | Arkansas | $32,344 | |
| 45. | Kentucky | $32,157 | |
| 46. | Tennessee | $32,136 | |
| 47. | West Virginia | $32,136 | |
| 48. | North Dakota | $31,970 | |
| 49. | Wyoming | $31,720 | |
| 50. | South Dakota | $30,888 |
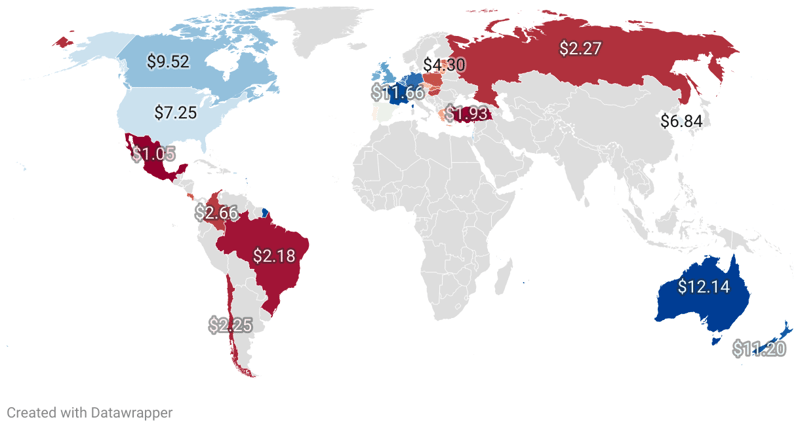
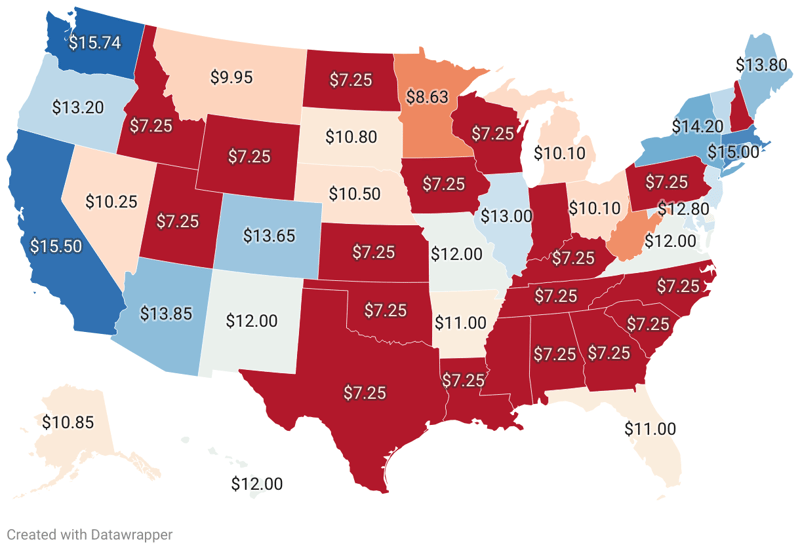
For decades, the conversation centering around wages has been of utmost significance to the American workforce. While the federal minimum wage has been stagnant at $7.25 per hour since 2009, the cost of living has seen steady progressions year on year. This causes attention to turn to the concept of the 'livable wage'— the income necessary to sustain an individual or a family's basic needs without the reliance on external aid or subsidies. With discrepancies across states due to varying costs of living, it becomes vital to dissect and study the rates of livable wages in each state .Using the living wage data from MIT's Living Wage Calculator, we have collated the livable wage figures across all 50 states.
The Most Expensive States to Live In are primarily located on the American coasts and are characterized by high costs of living and similarly high livable wage requirements. Topping the list is Hawaii, where residents need an average annual income of $45,739 to cover their basic needs without relying on external aid. This higher livable wage benchmark can be attributed to the state's unique geographical location leading to high costs for food, housing, and other essential commodities. New York, an epicenter for finance and culture, shares the top spot with Hawaii. Its higher livable wage of $45,739 annually can be reasoned by the state's housing expenses—particularly in New York City—and higher costs associated with transportation and utilities. The Northeastern state of Massachusetts follows closely with a required annual income of $45,510 to meet the living wage criterion. The state's high costs for healthcare and education significantly impact the living wage calculation. Similarly, California's combination of housing affordability challenges and high healthcare costs necessitates an annual income of $45,386 to meet the living needs. New Jersey wraps up our top five most expensive states with a livable wage of $42,786. Proceeding down the list, we find that Maryland, Oregon, Virginia, Colorado and Connecticut also require higher livable wages, ranging from $39,520 in Connecticut to $41,059 in Maryland. Most Expensive States to Live In:
Taking the lead as the state with the lowest livable wage is South Dakota. An individual living in this state would need to earn approximately $30,888 per year to cover basic needs and uphold a modest standard of living. Following closely, Wyoming holds the second lowest livable wage state, requiring slightly more at $31,720 per year. North Dakota comes in third with a livable wage depicting $31,970 as the baseline income. Fourth is West Virginia, where $32,136 is deemed enough for a basic standard of living, a figure matched uniquely by Tennessee, which ties at the same rank. Kentucky follows as the sixth lowest, with a necessary livable wage tallying up to $32,157 annually. Arkansas appears seventh on the list with a livable wage calculated at $32,344, closely trailed by Ohio commanding $32,469. With a marginal increase, Mississippi's livable wage is $32,573, earning it the 9th spot on this list. Residing in the final rung is Oklahoma, requiring an annual income of $32,760 to achieve a basic standard of living. States with the Lowest Livable Wage:
$33,093
Ranked in U.S.
#39
$34,778
Ranked in U.S.
#25
$36,254
Ranked in U.S.
#20
$32,344
Ranked in U.S.
#44
$45,386
Ranked in U.S.
#4
$39,853
Ranked in U.S.
#9
$39,520
Ranked in U.S.
#10
$36,899
Ranked in U.S.
#16
$35,859
Ranked in U.S.
#22
$36,691
Ranked in U.S.
#18
$45,739
Ranked in U.S.
#1
$33,613
Ranked in U.S.
#37
$37,773
Ranked in U.S.
#12
$32,843
Ranked in U.S.
#40
$33,654
Ranked in U.S.
#36
$34,070
Ranked in U.S.
#30
$32,157
Ranked in U.S.
#45
$33,592
Ranked in U.S.
#38
$37,190
Ranked in U.S.
#13
$41,059
Ranked in U.S.
#6
$45,510
Ranked in U.S.
#3
$34,029
Ranked in U.S.
#31
$36,899
Ranked in U.S.
#17
$32,573
Ranked in U.S.
#42
$33,883
Ranked in U.S.
#33
$33,946
Ranked in U.S.
#32
$34,528
Ranked in U.S.
#27
$33,779
Ranked in U.S.
#35
$36,026
Ranked in U.S.
#21
$42,786
Ranked in U.S.
#5
$33,800
Ranked in U.S.
#34
$45,739
Ranked in U.S.
#2
$35,651
Ranked in U.S.
#23
$31,970
Ranked in U.S.
#48
$32,469
Ranked in U.S.
#43
$32,760
Ranked in U.S.
#41
$40,581
Ranked in U.S.
#7
$34,674
Ranked in U.S.
#26
$37,024
Ranked in U.S.
#15
$36,338
Ranked in U.S.
#19
$30,888
Ranked in U.S.
#50
$32,136
Ranked in U.S.
#46
$34,133
Ranked in U.S.
#28
$35,318
Ranked in U.S.
#24
$37,045
Ranked in U.S.
#14
$40,352
Ranked in U.S.
#8
$38,563
Ranked in U.S.
#11
$32,136
Ranked in U.S.
#47
$34,112
Ranked in U.S.
#29
$31,720
Ranked in U.S.
#49
| Region ↕ | Livable Wage↕ |
|---|---|
| $33,093 | |
| $34,778 | |
| $36,254 | |
| $32,344 | |
| $45,386 | |
| $39,853 | |
| $39,520 | |
| $36,899 | |
| $35,859 | |
| $36,691 | |
| $45,739 | |
| $33,613 | |
| $37,773 | |
| $32,843 | |
| $33,654 | |
| $34,070 | |
| $32,157 | |
| $33,592 | |
| $37,190 | |
| $41,059 | |
| $45,510 | |
| $34,029 | |
| $36,899 | |
| $32,573 | |
| $33,883 | |
| $33,946 | |
| $34,528 | |
| $33,779 | |
| $36,026 | |
| $42,786 | |
| $33,800 | |
| $45,739 | |
| $35,651 | |
| $31,970 | |
| $32,469 | |
| $32,760 | |
| $40,581 | |
| $34,674 | |
| $37,024 | |
| $36,338 | |
| $30,888 | |
| $32,136 | |
| $34,133 | |
| $35,318 | |
| $37,045 | |
| $40,352 | |
| $38,563 | |
| $32,136 | |
| $34,112 | |
| $31,720 |