Guns Per Capita

1 | Wyoming | 237.31per 100 | |
2 | District of Columbia | 91.07per 100 | |
3 | New Mexico | 55.34per 100 | |
4 | New Hampshire | 46.86per 100 | |
5 | Virginia | 45.8per 100 | |
6 | South Dakota | 42.37per 100 | |
7 | Idaho | 38.84per 100 | |
8 | Alabama | 36.24per 100 | |
9 | Arkansas | 34.34per 100 | |
10 | Nevada | 34.09per 100 | |
11 | Alaska | 32.06per 100 | |
12 | North Dakota | 31.97per 100 | |
13 | Arizona | 30.81per 100 | |
14 | Utah | 30.43per 100 | |
15 | Texas | 28.63per 100 | |
16 | Louisiana | 27.41per 100 | |
17 | Montana | 25.7per 100 | |
18 | West Virginia | 24.96per 100 | |
19 | Pennsylvania | 24.83per 100 | |
20 | Georgia | 23.69per 100 | |
21 | Mississippi | 23.2per 100 | |
22 | Florida | 23.14per 100 | |
23 | Oklahoma | 22.97per 100 | |
24 | Kentucky | 22.23per 100 | |
25 | Colorado | 21.89per 100 | |
26 | Indiana | 21.24per 100 | |
27 | Connecticut | 21.11per 100 | |
28 | Maryland | 20.97per 100 | |
29 | Kansas | 20.86per 100 | |
30 | South Carolina | 20.18per 100 | |
31 | Oregon | 19.71per 100 | |
32 | Tennessee | 19.39per 100 | |
33 | Minnesota | 19.1per 100 | |
34 | North Carolina | 18.71per 100 | |
35 | Washington | 17.96per 100 | |
36 | Nebraska | 17.59per 100 | |
37 | Missouri | 16.1per 100 | |
38 | Ohio | 16.04per 100 | |
39 | Iowa | 14.77per 100 | |
40 | Wisconsin | 14.3per 100 | |
41 | Maine | 13.91per 100 | |
42 | Vermont | 13.41per 100 | |
43 | Illinois | 11.85per 100 | |
44 | New Jersey | 10.79per 100 | |
45 | California | 9.79per 100 | |
46 | Michigan | 9.34per 100 | |
47 | Hawaii | 6.49per 100 | |
48 | Massachusetts | 5.72per 100 | |
49 | Delaware | 5.71per 100 | |
50 | Rhode Island | 4.52per 100 | |
51 | New York | 4.51per 100 |
Last updated February 28, 2026
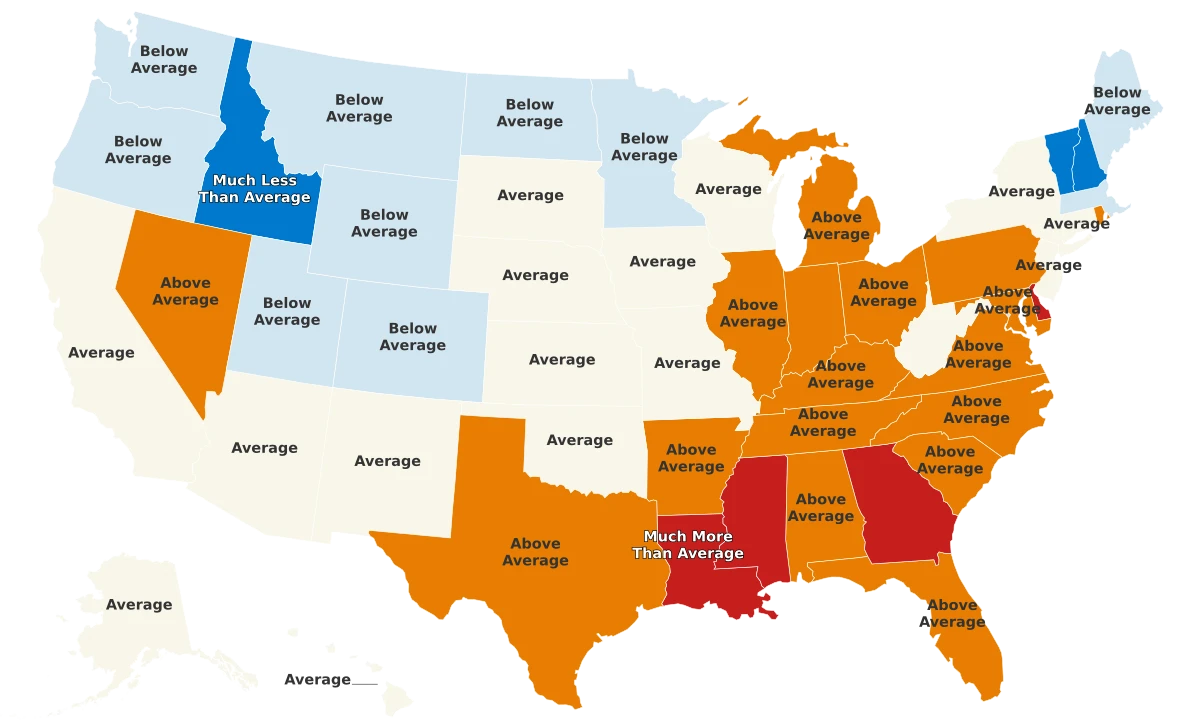
U.S. Gun Ownership
The United States is known globally for its unique relationship with firearms. With gun ownership deeply embedded in the country's constitution and culture, the prevalence of guns in America is unparalleled. As per the Small Arms Survey of 2017, the United States astonishingly had more guns than people — a ratio that's estimated to have only increased since. This article takes a closer look at the variation of gun ownership across the U.S., revealing how each of the 50 states stacks up when it comes to firearms per capita.
- New Mexico tops the list with 55,340 firearms per capita, far outpacing the next closest state, New Hampshire, which has 46,860 firearms per capita. Meanwhile, New York, with 4,510 firearms per capita, possesses significantly fewer guns per person.
- The most populous state, California, ranks 44th, with 9,790 firearms per capita — nearly half of the U.S. average. Small, rural states like Wyoming and South Dakota rank much higher, at 6th and 4th place respectively, reflective of national patterns indicating that gun ownership is more prevalent in rural areas.
- States with stringent gun laws like Massachusetts, Rhode Island, and New York, rank at the bottom, confirming the impact of local policy on gun ownership rates.
- A surprising data point is that New Hampshire, a Northeast state with typically less gun ownership, ranks second. This might be attributable to its relatively loose gun laws compared to its neighboring states.
All Metrics
| Region ↕ | Guns per Capita 2020↕ | Household Gun Ownership 2022↕ | Gun Ownership Licenses 2022↕ | Open Carry Legality↕ |
|---|---|---|---|---|
| Wyoming | ||||
| District of Columbia | ||||
| New Mexico | ||||
| New Hampshire | ||||
| Virginia | 45.80 | |||
| South Dakota | ||||
| Idaho | ||||
| Alabama | ||||
| Arkansas | ||||
| Nevada | ||||
| Alaska | ||||
| North Dakota | ||||
| Arizona | ||||
| Utah | ||||
| Texas | ||||
| Louisiana | ||||
| Montana | 25.70 | |||
| West Virginia | ||||
| Pennsylvania | ||||
| Georgia | ||||
| Mississippi | 23.20 | |||
| Florida | ||||
| Oklahoma | ||||
| Kentucky | ||||
| Colorado | ||||
| Indiana | ||||
| Connecticut | ||||
| Maryland | ||||
| Kansas | ||||
| South Carolina | ||||
| Oregon | ||||
| Tennessee | ||||
| Minnesota | 19.10 | |||
| North Carolina | ||||
| Washington | ||||
| Nebraska | ||||
| Missouri | 16.10 | |||
| Ohio | ||||
| Iowa | ||||
| Wisconsin | 14.30 | |||
| Maine | ||||
| Vermont | ||||
| Illinois | ||||
| New Jersey | ||||
| California | ||||
| Michigan | ||||
| Hawaii | ||||
| Massachusetts | ||||
| Delaware | ||||
| Rhode Island | ||||
| New York |
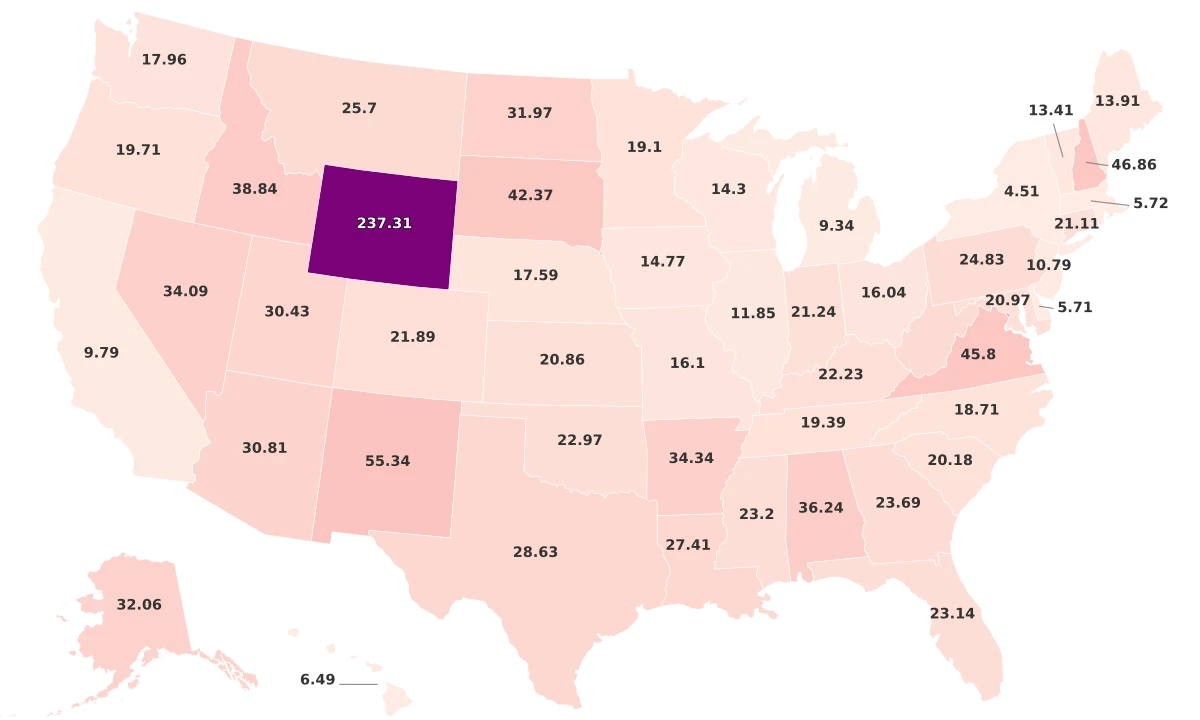
States with the Most Guns per Capita
New Mexico outpaces all other states significantly in firearms per capita, boasting a tremendous figure of 55,340 guns per 100,000 residents. The appeal of gun ownership in New Mexico can be attributed to a combination of cultural, historical, and legal factors that contribute to a robust tradition of firearm enthusiasm. The second-highest state, New Hampshire, reflects a somewhat unexpected trend. Despite being situated in the traditionally lower gun-ownership Northeast, the state has a notable 46,860 guns per 100,000 residents. Behind New Hampshire is the Commonwealth of Virginia, with 45,800 guns per capita. As both a Southern and Mid-Atlantic state, Virginia embodies a unique cross-section of firearm culture, history, and legislation. Next in line is South Dakota, boasting 42,370 guns per capita. Followed closely by Idaho with a substantial ownership rate of 38,840 guns per capita. The culture of hunting and outdoor activities in these largely rural states is likely a significant contributing factor to such high gun ownership rates. Wyoming, another rural state known for its strong tradition of hunting, has roughly 37,310 guns per capita. Alabama follows closely behind with 36,240 guns per person, while Arkansas comes next at 34,340 guns per capita. Nevada comes in ninth with 34,090 guns per person, no doubt influenced by the state's significant rural population and its observed culture of independence. Lastly, Alaska rounds out the top 10 list with 32,060 guns per capita, demonstrating a widespread culture of hunting and self-reliance. States with the Most Guns per Capita:
- New Mexico - 55,340
- New Hampshire - 46,860
- Virginia - 45,800
- South Dakota - 42,370
- Idaho - 38,840
- Wyoming - 37,310
- Alabama - 36,240
- Arkansas - 34,340
- Nevada - 34,090
- Alaska - 32,060
States with the Least Guns per Capita
Leading with the least guns per capita is the state of New York, with 4,510 firearms per 100,000 people. Following closely is Rhode Island, with 4,520 guns per capita. Third on the list is Delaware, reporting 5,710 guns per capita. Massachusetts isn’t far behind with 5,720 guns per capita, and Hawaii takes the fifth spot with 6,490 guns per capita. Moving further, we have Michigan and California in the sixth and seventh spots with 9,340 and 9,790 guns per capita, respectively. New Jersey and Illinois, with 10,790 and 11,850 guns per capita, fall next in the ranking. Vermont completes the list of the ten states with the least guns per capita with a figure of 13,410 guns recorded for every 100,000 individuals. States with the Least Guns per Capita:
- New York - 4,510
- Rhode Island - 4,520
- Delaware - 5,710
- Massachusetts - 5,720
- Hawaii - 6,490
- Michigan - 9,340
- California - 9,790
- New Jersey - 10,790
- Illinois - 11,850
- Vermont - 13,410
Sources & Notes
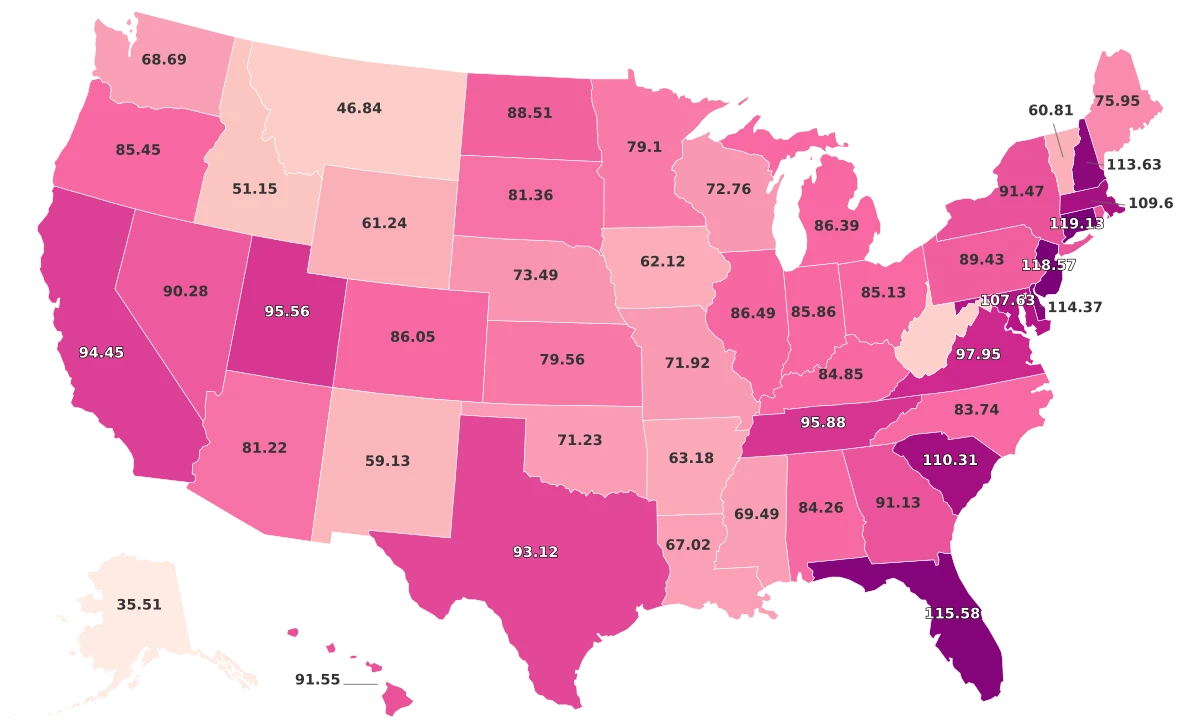
Number of civilian-owned firearms per 100 people.
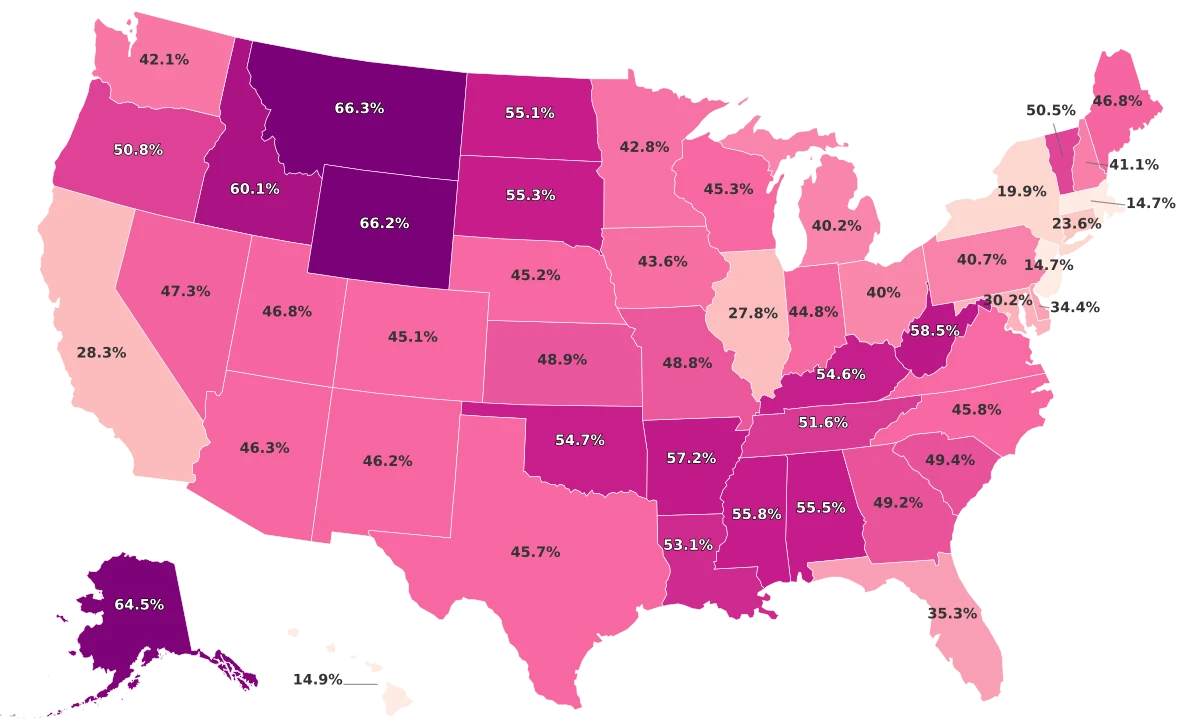
Percentage of households that own at least one firearm.
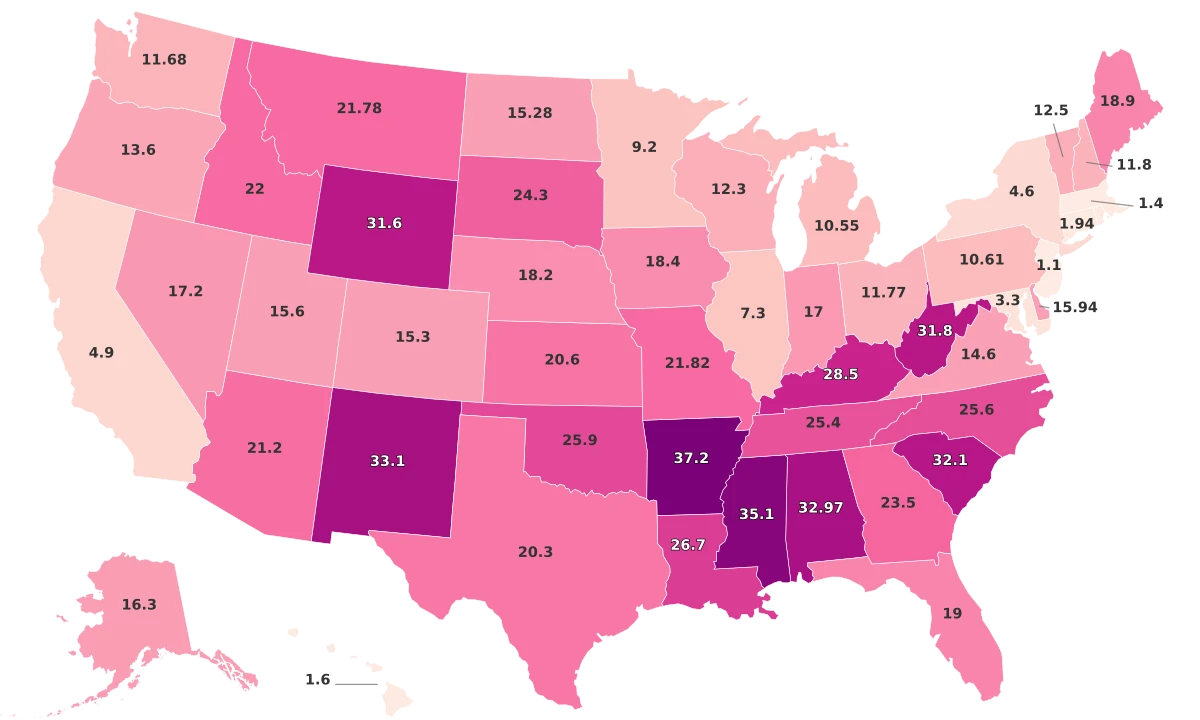
Total legal permits issued to own a firearm.