Last updated March 12, 2025

| 1. | Ukraine | $3.5K | |
| 2. | Moldova | $4.6K | |
| 3. | Albania | $5.2K | |
| 4. | North Macedonia | $5.7K | |
| 5. | Bosnia and Herzegovina | $6.1K | |
| 6. | Belarus | $6.3K | |
| 7. | Serbia | $7.4K | |
| 8. | Montenegro | $7.9K | |
| 9. | Bulgaria | $9.5K | |
| 11. | Romania | $12.6K | |
| 12. | Croatia | $14.2K | |
| 13. | Poland | $15.3K | |
| 14. | Hungary | $16.5K | |
| 15. | Latvia | $17.7K | |
| 16. | Slovakia | $18.7K | |
| 17. | Lithuania | $19.0K | |
| 18. | Greece | $19.7K | |
| 19. | Czech Republic | $21.9K | |
| 20. | Portugal | $22.0K | |
| 21. | Estonia | $23.2K | |
| 22. | Malta | $25.4K | |
| 23. | Slovenia | $25.9K | |
| 24. | Cyprus | $26.1K | |
| 25. | Spain | $30.3K | |
| 26. | Italy | $32.2K | |
| 27. | United Kingdom | $42.1K | |
| 28. | France | $42.3K | |
| 29. | Germany | $47.0K | |
| 30. | Belgium | $48.0K | |
| 31. | Finland | $49.6K | |
| 32. | Austria | $51.4K | |
| 33. | Netherlands | $53.0K | |
| 34. | Sweden | $53.8K | |
| 35. | Denmark | $62.7K | |
| 36. | Ireland | $63.5K | |
| 37. | Luxembourg | $70.8K | |
| 38. | Iceland | $72.9K | |
| 39. | Norway | $78.3K | |
| 40. | Isle Of Man | $83.2K | |
| 41. | Switzerland | $88.0K |
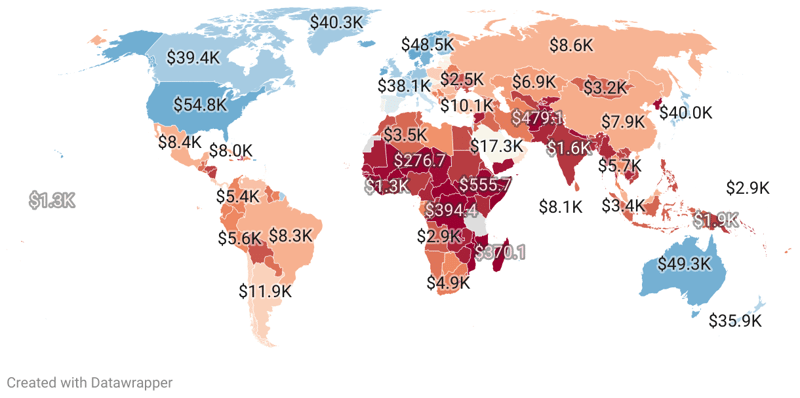
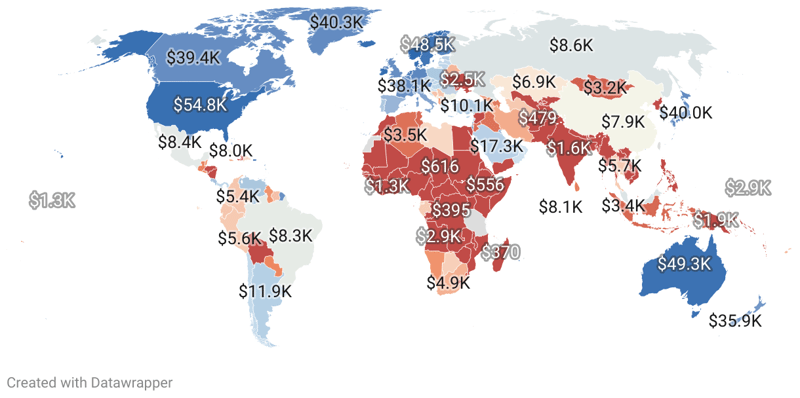
The economic disparity between countries within the European continent is striking. While countries like Switzerland, Norway, and the Isle of Man boast some of the world's highest Gross National Income (GNI) per capita values, other nations lag significantly behind. This article dives into data highlighting the poorest countries of Europe, measured by their GNI per capita, a key indicator of economic prosperity.
While Europe houses several nations with booming economies, countries like Ukraine, Moldova, and Albania face substantial economic challenges with the lowest GNIs per capita. These challenges are multifaceted, involving struggles with political stability, infrastructure, and socio-economic inequality, among others.
Key findings from the data include:
The data reveal that the ten poorest countries in Europe are Ukraine, Moldova, Albania, North Macedonia, Bosnia and Herzegovina, Belarus, Serbia, Montenegro, Bulgaria, and Romania. These nations demonstrate unique economic landscapes and face a diverse array of challenges.
Ukraine has the lowest Gross National Income (GNI) per capita among these nations, standing at a concerning $3.5K. Moldova follows closely, with a GNI per capita of $4.6K, while Albania, North Macedonia, and Bosnia and Herzegovina each have a GNI per capita in the $5K range ($5.2K, $5.7K, $6.1K, respectively). Belarus does not lag far behind with a GNI per capita of $6.3K.
The last four countries in the ten poorest of Europe are Serbia, Montenegro, Bulgaria, and Romania, each with a GNI per capita under $12.6K. Bulgaria and Romania are on upward trends, with Bulgaria's GNI per capita having increased from $9K to $9.5K from 2020 to 2022.
10 Poorest Countries in Europe (by GNI per capita):
Ranked in Europe
#3
$51.4K
Ranked in Europe
#32
Ranked in Europe
#6
$48.0K
Ranked in Europe
#30
Ranked in Europe
#5
Ranked in Europe
#9
$14.2K
Ranked in Europe
#12
$26.1K
Ranked in Europe
#24
$21.9K
Ranked in Europe
#19
$62.7K
Ranked in Europe
#35
$23.2K
Ranked in Europe
#21
$49.6K
Ranked in Europe
#31
$42.3K
Ranked in Europe
#28
$47.0K
Ranked in Europe
#29
$19.7K
Ranked in Europe
#18
$16.5K
Ranked in Europe
#14
$72.9K
Ranked in Europe
#38
$63.5K
Ranked in Europe
#36
$83.2K
Ranked in Europe
#40
$32.2K
Ranked in Europe
#26
$17.7K
Ranked in Europe
#15
$19.0K
Ranked in Europe
#17
$70.8K
Ranked in Europe
#37
$25.4K
Ranked in Europe
#22
Ranked in Europe
#2
Ranked in Europe
#8
$53.0K
Ranked in Europe
#33
Ranked in Europe
#4
$78.3K
Ranked in Europe
#39
$15.3K
Ranked in Europe
#13
$22.0K
Ranked in Europe
#20
$12.6K
Ranked in Europe
#11
Ranked in Europe
#7
$18.7K
Ranked in Europe
#16
$25.9K
Ranked in Europe
#23
$30.3K
Ranked in Europe
#25
$53.8K
Ranked in Europe
#34
$88.0K
Ranked in Europe
#41
Ranked in Europe
#1
$42.1K
Ranked in Europe
#27
| Region ↕ | Europe GNI Per Capita↕ |
|---|---|
| $5.2K | |
| $51.4K | |
| $6.3K | |
| $48.0K | |
| $6.1K | |
| $9.5K | |
| $14.2K | |
| $26.1K | |
| $21.9K | |
| $62.7K | |
| $23.2K | |
| $49.6K | |
| $42.3K | |
| $47.0K | |
| $19.7K | |
| $16.5K | |
| $72.9K | |
| $63.5K | |
| $83.2K | |
| $32.2K | |
| $17.7K | |
| $19.0K | |
| $70.8K | |
| $25.4K | |
| $4.6K | |
| $7.9K | |
| $53.0K | |
| $5.7K | |
| $78.3K | |
| $15.3K | |
| $22.0K | |
| $12.6K | |
| $7.4K | |
| $18.7K | |
| $25.9K | |
| $30.3K | |
| $53.8K | |
| $88.0K | |
| $3.5K | |
| $42.1K |