Maine
See More
Ranked in U.S.
#3
Last updated September 18, 2024
| 1. | Alaska | 81.1% | |
| 2. | Michigan | 80.7% | |
| 3. | Maine | 80.6% | |
| 4. | Kentucky | 78.7% | |
| 5. | Vermont | 76.4% | |
| 6. | North Dakota | 74.5% | |
| 7. | Delaware | 73.2% | |
| 8. | Colorado | 72.8% | |
| 9. | New Jersey | 71.3% | |
| 10. | Alabama | 71.2% | |
| 11. | Oregon | 70.3% | |
| 12. | Missouri | 70.1% | |
| 13. | Illinois | 69.9% | |
| 14. | Indiana | 69.3% | |
| 15. | Iowa | 69.2% | |
| 16. | Virginia | 69.0% | |
| 17. | Connecticut | 68.1% | |
| 18. | Massachusetts | 67.8% | |
| 19. | Mississippi | 67.8% | |
| 20. | Pennsylvania | 67.4% | |
| 21. | Maryland | 67.2% | |
| 22. | North Carolina | 67.1% | |
| 23. | South Carolina | 66.6% | |
| 24. | New York | 66.6% | |
| 25. | Louisiana | 66.2% | |
| 26. | Ohio | 66.2% | |
| 27. | Nevada | 65.7% | |
| 28. | Kansas | 65.2% | |
| 29. | Rhode Island | 65.0% | |
| 30. | Montana | 64.9% | |
| 31. | West Virginia | 64.0% | |
| 32. | New Mexico | 63.7% | |
| 33. | Georgia | 63.5% | |
| 34. | Florida | 63.0% | |
| 35. | Nebraska | 62.7% | |
| 36. | South Dakota | 62.5% | |
| 37. | Minnesota | 62.2% | |
| 38. | New Hampshire | 62.0% | |
| 39. | Washington | 61.5% | |
| 40. | Tennessee | 59.7% | |
| 41. | Wisconsin | 58.9% | |
| 42. | Arizona | 58.4% | |
| 43. | Hawaii | 58.1% | |
| 44. | Arkansas | 57.9% | |
| 45. | California | 56.5% | |
| 46. | Idaho | 54.8% | |
| 47. | Oklahoma | 54.8% | |
| 48. | Utah | 54.6% | |
| 49. | Texas | 52.3% | |
| 50. | Wyoming | 48.1% |
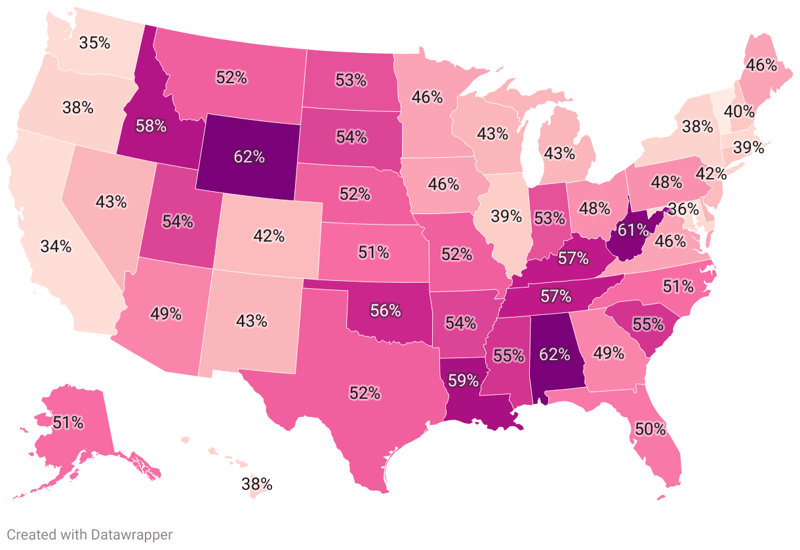
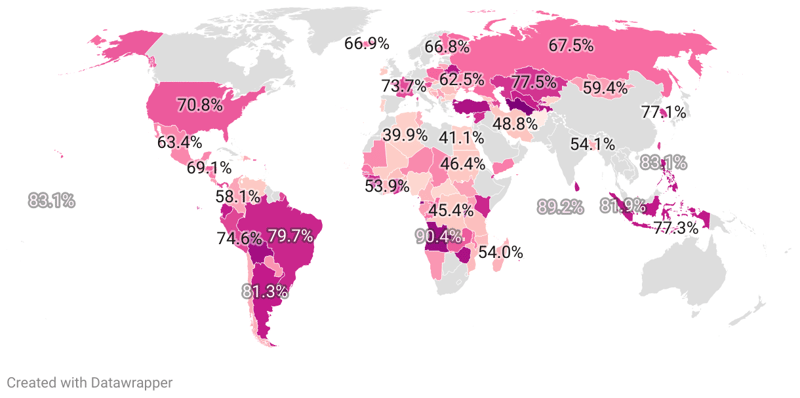
Understanding the number of registered voters per state is a crucial factor in gauging the democratic pulse of a nation. It is a parameter that impacts election outcomes and illuminates the level of political participation and engagement across the United States. Voter registration, simply put, is the process by which eligible citizens sign up to exercise their right to vote. This varies from state to state, with some implementing automatic registration, while others require manual submission of an application, and these differing methods can significantly affect registration rates. A significant turnaround was seen in the recent 2020 presidential elections, where around 66.8% of U.S. citizens aged 18 and over voted - marking the highest voter turnout of the century. Notably, every state reported an increased voter turnout compared to the 2016 Presidential Election, despite the looming shadow of COVID-19 pandemic. Various contextual elements, including race, age, and educational attainment, also impact voter registration and turnout. Furthermore, certain policies such as automatic voter registration, same-day registration, online registration, early voting, and restoring voting rights for previously incarcerated people have shown to bolster registration and participation.
Ranked in U.S.
#10
Ranked in U.S.
#1
Ranked in U.S.
#42
Ranked in U.S.
#44
Ranked in U.S.
#45
Ranked in U.S.
#8
Ranked in U.S.
#17
Ranked in U.S.
#7
Ranked in U.S.
#34
Ranked in U.S.
#33
Ranked in U.S.
#43
Ranked in U.S.
#46
Ranked in U.S.
#13
Ranked in U.S.
#14
Ranked in U.S.
#15
Ranked in U.S.
#28
Ranked in U.S.
#4
Ranked in U.S.
#25
Ranked in U.S.
#3
Ranked in U.S.
#21
Ranked in U.S.
#18
Ranked in U.S.
#2
Ranked in U.S.
#37
Ranked in U.S.
#19
Ranked in U.S.
#12
Ranked in U.S.
#30
Ranked in U.S.
#35
Ranked in U.S.
#27
Ranked in U.S.
#38
Ranked in U.S.
#9
Ranked in U.S.
#32
Ranked in U.S.
#24
Ranked in U.S.
#22
Ranked in U.S.
#6
Ranked in U.S.
#26
Ranked in U.S.
#47
Ranked in U.S.
#11
Ranked in U.S.
#20
Ranked in U.S.
#29
Ranked in U.S.
#23
Ranked in U.S.
#36
Ranked in U.S.
#40
Ranked in U.S.
#49
Ranked in U.S.
#48
Ranked in U.S.
#5
Ranked in U.S.
#16
Ranked in U.S.
#39
Ranked in U.S.
#31
Ranked in U.S.
#41
Ranked in U.S.
#50
| Region ↕ | Percentage of Registered Voters↕ |
|---|---|
| 71.2% | |
| 81.1% | |
| 58.4% | |
| 57.9% | |
| 56.5% | |
| 72.8% | |
| 68.1% | |
| 73.2% | |
| 63.0% | |
| 63.5% | |
| 58.1% | |
| 54.8% | |
| 69.9% | |
| 69.3% | |
| 69.2% | |
| 65.2% | |
| 78.7% | |
| 66.2% | |
| 80.6% | |
| 67.2% | |
| 67.8% | |
| 80.7% | |
| 62.2% | |
| 67.8% | |
| 70.1% | |
| 64.9% | |
| 62.7% | |
| 65.7% | |
| 62.0% | |
| 71.3% | |
| 63.7% | |
| 66.6% | |
| 67.1% | |
| 74.5% | |
| 66.2% | |
| 54.8% | |
| 70.3% | |
| 67.4% | |
| 65.0% | |
| 66.6% | |
| 62.5% | |
| 59.7% | |
| 52.3% | |
| 54.6% | |
| 76.4% | |
| 69.0% | |
| 61.5% | |
| 64.0% | |
| 58.9% | |
| 48.1% |