Maine
See More
Ranked in U.S.
#35
Last updated November 24, 2024
| 1. | Alaska | 1.09 | |
| 2. | North Dakota | 1.05 | |
| 3. | Wyoming | 1.04 | |
| 4. | South Dakota | 1.02 | |
| 5. | Colorado | 1.01 | |
| 6. | Utah | 1.01 | |
| 7. | Montana | 1.01 | |
| 8. | Nevada | 1.01 | |
| 9. | Hawaii | 1.01 | |
| 10. | Idaho | 1.01 | |
| 11. | Washington | 1.00 | |
| 12. | Nebraska | 1.00 | |
| 13. | Kansas | 0.99 | |
| 14. | Minnesota | 0.99 | |
| 15. | Wisconsin | 0.99 | |
| 16. | California | 0.99 | |
| 17. | Arizona | 0.99 | |
| 18. | Iowa | 0.99 | |
| 19. | Texas | 0.99 | |
| 20. | New Hampshire | 0.98 | |
| 21. | Oregon | 0.98 | |
| 22. | Oklahoma | 0.98 | |
| 23. | New Mexico | 0.98 | |
| 24. | West Virginia | 0.98 | |
| 25. | Vermont | 0.98 | |
| 26. | Indiana | 0.97 | |
| 27. | Kentucky | 0.97 | |
| 28. | Michigan | 0.97 | |
| 29. | Virginia | 0.97 | |
| 30. | Illinois | 0.97 | |
| 31. | Arkansas | 0.96 | |
| 32. | Missouri | 0.96 | |
| 33. | Ohio | 0.96 | |
| 34. | Pennsylvania | 0.96 | |
| 35. | Maine | 0.96 | |
| 36. | Florida | 0.96 | |
| 37. | New Jersey | 0.96 | |
| 38. | Louisiana | 0.95 | |
| 39. | Tennessee | 0.95 | |
| 40. | Connecticut | 0.95 | |
| 41. | Georgia | 0.95 | |
| 42. | North Carolina | 0.95 | |
| 43. | Rhode Island | 0.95 | |
| 44. | New York | 0.94 | |
| 45. | Massachusetts | 0.94 | |
| 46. | South Carolina | 0.94 | |
| 47. | Maryland | 0.94 | |
| 48. | Mississippi | 0.94 | |
| 49. | Alabama | 0.94 | |
| 50. | Delaware | 0.94 |
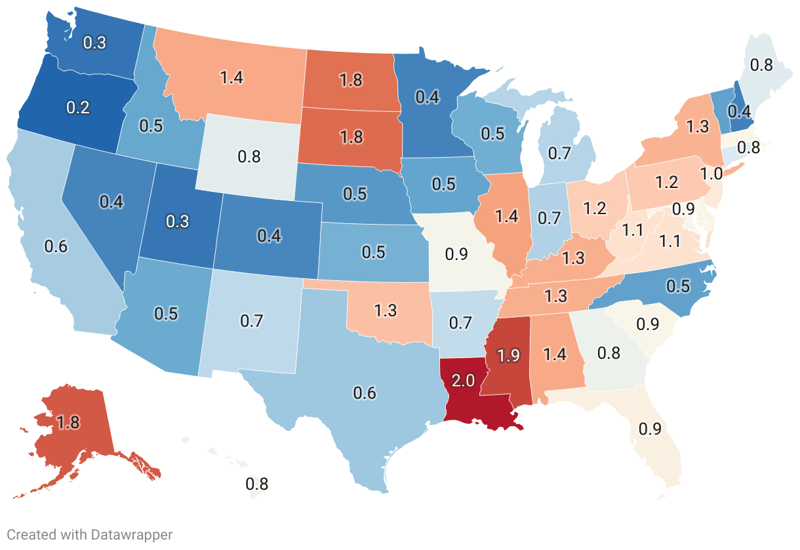
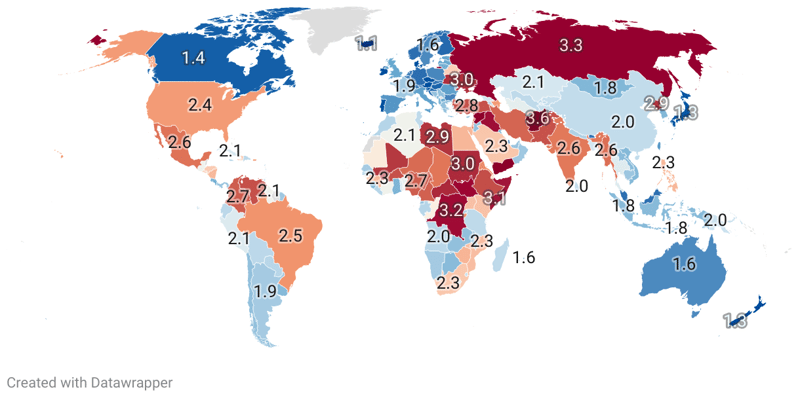
Understanding the varying dynamics of the population in different regions is essential and sex ratio is a key demographic parameter providing substantive information in this regard. It not only gives a clear view of the number of males in comparison to females within a specific geographic location but also indicates the potential for population growth and movability.
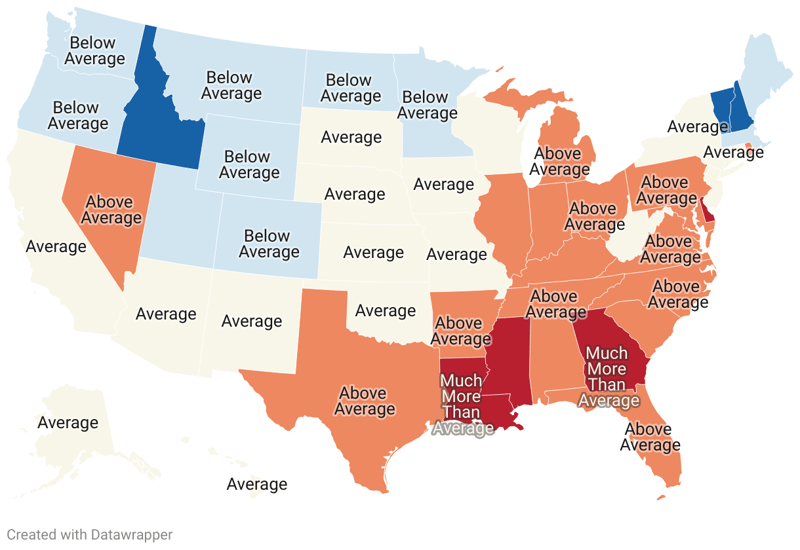
Standing at the pinnacle is Alaska, with a male to female ratio of a substantial 1.09. Following closely behind is North Dakota, boasting a male to female ratio of 1.05. Similar to Alaska, North Dakota's industries and development opportunities might be drawing in more male population and contributing to the skewed ratio. Wyoming ranks third, with a predominantly male population resulting in a male to female ratio of 1.04. Moving down the list, we find South Dakota, Colorado, Utah, Montana, Nevada, Hawaii, and Idaho, all with a male to female ratio of 1.01 or 1.02.
States with the Highest Male to Female Ratio:
Ranked in U.S.
#49
Ranked in U.S.
#1
Ranked in U.S.
#17
Ranked in U.S.
#31
Ranked in U.S.
#16
Ranked in U.S.
#5
Ranked in U.S.
#40
Ranked in U.S.
#50
Ranked in U.S.
#36
Ranked in U.S.
#41
Ranked in U.S.
#9
Ranked in U.S.
#10
Ranked in U.S.
#30
Ranked in U.S.
#26
Ranked in U.S.
#18
Ranked in U.S.
#13
Ranked in U.S.
#27
Ranked in U.S.
#38
Ranked in U.S.
#35
Ranked in U.S.
#47
Ranked in U.S.
#45
Ranked in U.S.
#28
Ranked in U.S.
#14
Ranked in U.S.
#48
Ranked in U.S.
#32
Ranked in U.S.
#7
Ranked in U.S.
#12
Ranked in U.S.
#8
Ranked in U.S.
#20
Ranked in U.S.
#37
Ranked in U.S.
#23
Ranked in U.S.
#44
Ranked in U.S.
#42
Ranked in U.S.
#2
Ranked in U.S.
#33
Ranked in U.S.
#22
Ranked in U.S.
#21
Ranked in U.S.
#34
Ranked in U.S.
#43
Ranked in U.S.
#46
Ranked in U.S.
#4
Ranked in U.S.
#39
Ranked in U.S.
#19
Ranked in U.S.
#6
Ranked in U.S.
#25
Ranked in U.S.
#29
Ranked in U.S.
#11
Ranked in U.S.
#24
Ranked in U.S.
#15
Ranked in U.S.
#3
| Region ↕ | Male to Female Ratio↕ |
|---|---|
| 0.94 | |
| 1.09 | |
| 0.99 | |
| 0.96 | |
| 0.99 | |
| 1.01 | |
| 0.95 | |
| 0.94 | |
| 0.96 | |
| 0.95 | |
| 1.01 | |
| 1.01 | |
| 0.97 | |
| 0.97 | |
| 0.99 | |
| 0.99 | |
| 0.97 | |
| 0.95 | |
| 0.96 | |
| 0.94 | |
| 0.94 | |
| 0.97 | |
| 0.99 | |
| 0.94 | |
| 0.96 | |
| 1.01 | |
| 1.00 | |
| 1.01 | |
| 0.98 | |
| 0.96 | |
| 0.98 | |
| 0.94 | |
| 0.95 | |
| 1.05 | |
| 0.96 | |
| 0.98 | |
| 0.98 | |
| 0.96 | |
| 0.95 | |
| 0.94 | |
| 1.02 | |
| 0.95 | |
| 0.99 | |
| 1.01 | |
| 0.98 | |
| 0.97 | |
| 1.00 | |
| 0.98 | |
| 0.99 | |
| 1.04 |