Last updated September 18, 2024
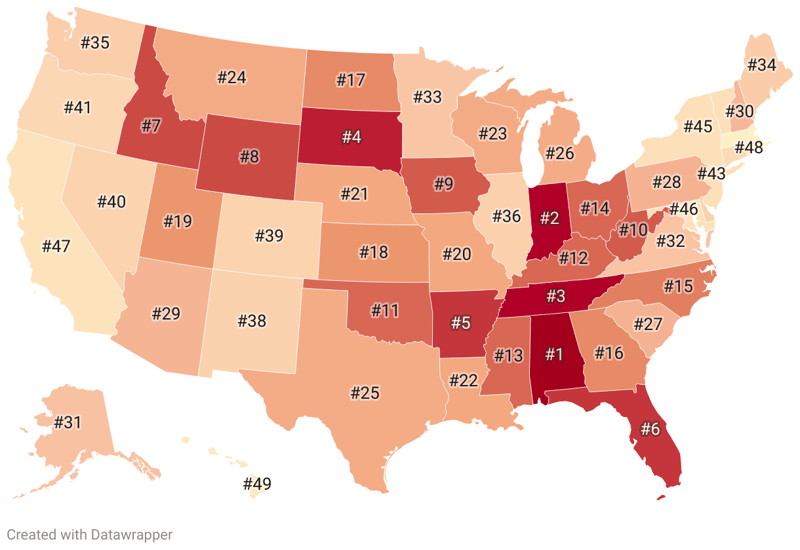
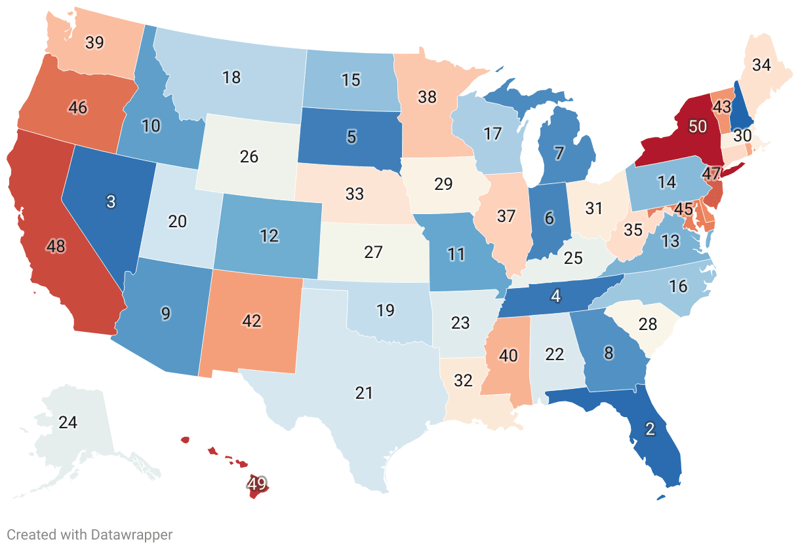
Delegate Count by State

Delegate Count
Top
Last
Delegate Count
1.CaliforniaCalifornia587
2.TexasTexas383
3.FloridaFlorida341
4.PennsylvaniaPennsylvania274
5.New YorkNew York274
6.IllinoisIllinois222
7.OhioOhio218
8.MichiganMichigan198
9.North CarolinaNorth Carolina181
10.GeorgiaGeorgia181
11.New JerseyNew Jersey175
12.IndianaIndiana140
13.WisconsinWisconsin136
14.MarylandMaryland134
15.WashingtonWashington132
16.MassachusettsMassachusetts132
17.ArizonaArizona124
18.TennesseeTennessee122
19.MissouriMissouri122
20.MinnesotaMinnesota114
21.ColoradoColorado104
22.AlabamaAlabama102
23.LouisianaLouisiana100
24.KentuckyKentucky100
25.VirginiaVirginia99
26.OregonOregon89
27.ConnecticutConnecticut88
28.IowaIowa81
29.OklahomaOklahoma80
30.MississippiMississippi76
31.ArkansasArkansas71
32.UtahUtah69
33.NebraskaNebraska65
34.West VirginiaWest Virginia63
35.NevadaNevada61
36.New MexicoNew Mexico56
37.South CarolinaSouth Carolina54
38.IdahoIdaho52
39.KansasKansas51
40.MaineMaine46
41.MontanaMontana46
42.New HampshireNew Hampshire46
43.Rhode IslandRhode Island45
44.South DakotaSouth Dakota45
45.North DakotaNorth Dakota43
46.WyomingWyoming43
47.District of ColumbiaDistrict of Columbia39
48.DelawareDelaware37
49.VermontVermont33
50.HawaiiHawaii24
51.AlaskaAlaska15

The Power of Delegates

Understanding the delegate count by state is a crucial component during the U.S. Presidential Primaries, as it significantly impacts the nomination of each party's Presidential candidate. Delegates represent the people's will and can often determine the choice of the Presidential candidate, making them an essential element of the democratic process. The assignment of delegates varies depending on the state's population, primary voting system, and party rules. In turn, the type of delegate - pledged or super for Democrats, and pledged or unpledged for Republicans - and how these delegates are allocated, also varies, adding another layer of complexity to the race.

  • California, being the most populous state in the U.S., has the lion's share of delegates with a whopping count of 587. Its vast pool of delegates make it a major battleground state for candidates.
  • The disparity in delegate allocation is clear when comparing heavily populated states like California, Texas (383 delegates), and New York (274 delegates) to less populated ones like Wyoming (43 delegates) and North Dakota (43 delegates). In these smaller states, each delegate may represent far fewer voters, leading to differences in representation power.
  • Mid-sized states such as Louisiana, Virginia, and Alabama exhibit a range of delegate counts despite their similar sizes, showing how population is responsible for the delegate allocation.
  • Alaska, with its vast territory but small population, has one of the lowest delegate counts, only 15.

By Region

Alabama

See Less
Alabama

Metric

Value

Rank

Alaska

See More
Alaska

Metric

Value

Rank

Arizona

See More
Arizona

Metric

Value

Rank

Arkansas

See More
Arkansas

Metric

Value

Rank

California

See More
California

Metric

Value

Rank

Colorado

See More
Colorado

Metric

Value

Rank

Connecticut

See More
Connecticut

Metric

Value

Rank

Delaware

See More
Delaware

Metric

Value

Rank

District of Columbia

See More
District of Columbia

Metric

Value

Rank

Florida

See More
Florida

Metric

Value

Rank

Georgia

See More
Georgia

Metric

Value

Rank

Hawaii

See More
Hawaii

Metric

Value

Rank

Idaho

See More
Idaho

Metric

Value

Rank

Illinois

See More
Illinois

Metric

Value

Rank

Indiana

See More
Indiana

Metric

Value

Rank

Iowa

See More
Iowa

Metric

Value

Rank

Kansas

See More
Kansas

Metric

Value

Rank

Kentucky

See More
Kentucky

Metric

Value

Rank

Louisiana

See More
Louisiana

Metric

Value

Rank

Maine

See More
Maine

Metric

Value

Rank

Maryland

See More
Maryland

Metric

Value

Rank

Massachusetts

See More
Massachusetts

Metric

Value

Rank

Michigan

See More
Michigan

Metric

Value

Rank

Minnesota

See More
Minnesota

Metric

Value

Rank

Mississippi

See More
Mississippi

Metric

Value

Rank

Missouri

See More
Missouri

Metric

Value

Rank

Montana

See More
Montana

Metric

Value

Rank

Nebraska

See More
Nebraska

Metric

Value

Rank

Nevada

See More
Nevada

Metric

Value

Rank

New Hampshire

See More
New Hampshire

Metric

Value

Rank

New Jersey

See More
New Jersey

Metric

Value

Rank

New Mexico

See More
New Mexico

Metric

Value

Rank

New York

See More
New York

Metric

Value

Rank

North Carolina

See More
North Carolina

Metric

Value

Rank

North Dakota

See More
North Dakota

Metric

Value

Rank

Ohio

See More
Ohio

Metric

Value

Rank

Oklahoma

See More
Oklahoma

Metric

Value

Rank

Oregon

See More
Oregon

Metric

Value

Rank

Pennsylvania

See More
Pennsylvania

Metric

Value

Rank

Rhode Island

See More
Rhode Island

Metric

Value

Rank

South Carolina

See More
South Carolina

Metric

Value

Rank

South Dakota

See More
South Dakota

Metric

Value

Rank

Tennessee

See More
Tennessee

Metric

Value

Rank

Texas

See More
Texas

Metric

Value

Rank

Utah

See More
Utah

Metric

Value

Rank

Vermont

See More
Vermont

Metric

Value

Rank

Virginia

See More
Virginia

Metric

Value

Rank

Washington

See More
Washington

Metric

Value

Rank

West Virginia

See More
West Virginia

Metric

Value

Rank

Wisconsin

See More
Wisconsin

Metric

Value

Rank

Wyoming

See More
Wyoming

Metric

Value

Rank

Table

Region ↕Delegate Count↕
Alabama iconAlabama102
Alaska iconAlaska15
Arizona iconArizona124
Arkansas iconArkansas71
California iconCalifornia587
Colorado iconColorado104
Connecticut iconConnecticut88
Delaware iconDelaware37
District of Columbia iconDistrict of Columbia39
Florida iconFlorida341
Georgia iconGeorgia181
Hawaii iconHawaii24
Idaho iconIdaho52
Illinois iconIllinois222
Indiana iconIndiana140
Iowa iconIowa81
Kansas iconKansas51
Kentucky iconKentucky100
Louisiana iconLouisiana100
Maine iconMaine46
Maryland iconMaryland134
Massachusetts iconMassachusetts132
Michigan iconMichigan198
Minnesota iconMinnesota114
Mississippi iconMississippi76
Missouri iconMissouri122
Montana iconMontana46
Nebraska iconNebraska65
Nevada iconNevada61
New Hampshire iconNew Hampshire46
New Jersey iconNew Jersey175
New Mexico iconNew Mexico56
New York iconNew York274
North Carolina iconNorth Carolina181
North Dakota iconNorth Dakota43
Ohio iconOhio218
Oklahoma iconOklahoma80
Oregon iconOregon89
Pennsylvania iconPennsylvania274
Rhode Island iconRhode Island45
South Carolina iconSouth Carolina54
South Dakota iconSouth Dakota45
Tennessee iconTennessee122
Texas iconTexas383
Utah iconUtah69
Vermont iconVermont33
Virginia iconVirginia99
Washington iconWashington132
West Virginia iconWest Virginia63
Wisconsin iconWisconsin136
Wyoming iconWyoming43
Keep reading

Additional Political Datasets

Most Conservative Cities
Politics
U.S. Cities

Most Conservative Cities

Most Conservative Countries

Most Conservative Countries

Most Conservative States

Most Conservative States

Most Liberal Countries

Most Liberal Countries

Most Liberal States

Most Liberal States

Most Libertarian States

Most Libertarian States