Maine
See More
Ranked in U.S.
#45
% of Population
1.66%
Ranked in U.S.
#47
Last updated November 24, 2024
| 1. | California | 6.8M | |
| 2. | New York | 1.9M | |
| 3. | Texas | 1.7M | |
| 4. | New Jersey | 949.0K | |
| 5. | Washington | 854.6K | |
| 6. | Illinois | 828.8K | |
| 7. | Hawaii | 803.3K | |
| 8. | Florida | 763.6K | |
| 9. | Virginia | 691.4K | |
| 10. | Massachusetts | 538.4K | |
| 11. | Pennsylvania | 532.3K | |
| 12. | Georgia | 515.4K | |
| 13. | Maryland | 463.3K | |
| 14. | Michigan | 390.9K | |
| 15. | North Carolina | 377.9K | |
| 16. | Ohio | 344.1K | |
| 17. | Minnesota | 330.7K | |
| 18. | Arizona | 326.4K | |
| 19. | Nevada | 320.6K | |
| 20. | Oregon | 258.2K | |
| 21. | Colorado | 252.6K | |
| 22. | Wisconsin | 203.1K | |
| 23. | Connecticut | 196.3K | |
| 24. | Indiana | 195.1K | |
| 25. | Missouri | 161.5K | |
| 26. | Tennessee | 155.6K | |
| 27. | Oklahoma | 116.7K | |
| 28. | Utah | 112.4K | |
| 29. | South Carolina | 110.7K | |
| 30. | Kansas | 110.2K | |
| 31. | Louisiana | 99.7K | |
| 32. | Iowa | 97.9K | |
| 33. | Alabama | 89.0K | |
| 34. | Kentucky | 88.1K | |
| 35. | Alaska | 64.7K | |
| 36. | Nebraska | 62.5K | |
| 37. | Arkansas | 59.9K | |
| 38. | New Mexico | 48.9K | |
| 39. | New Hampshire | 47.7K | |
| 40. | Delaware | 45.7K | |
| 41. | Rhode Island | 45.5K | |
| 42. | Idaho | 42.6K | |
| 43. | Mississippi | 39.2K | |
| 44. | District of Columbia | 37.8K | |
| 45. | Maine | 23.2K | |
| 46. | West Virginia | 20.8K | |
| 47. | North Dakota | 16.4K | |
| 48. | South Dakota | 16.1K | |
| 49. | Montana | 15.6K | |
| 50. | Vermont | 15.0K | |
| 51. | Wyoming | 9.2K |
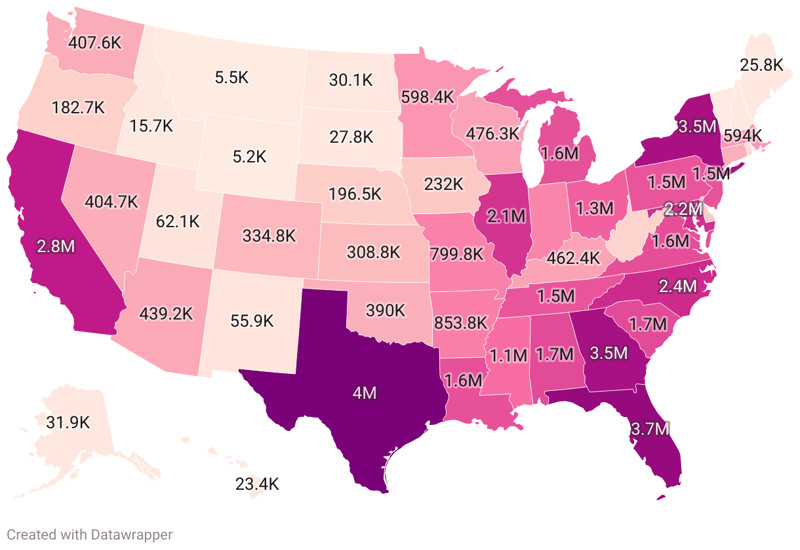
The United States offers a vibrant and diverse cultural tapestry, woven into every corner of the nation. An integral part of this rich tableau is the Asian-American community, a heterogeneous group with roots stretching back to numerous countries across Asia. From the early settlement of Manilamen in Louisiana to the large waves of immigration after 1965, Asian-Americans have forged an indelible mark on the shaping and evolution of the America we know today. In the 2020 U.S. Census, a notable 24 million people identified as Asian American, making up 7.2% of the total population. This article examines the distribution of this population across the 50 U.S. states and the District of Columbia.
Key findings from the data include:
| Region ↕ | Total Asian Population↕ | % of Population↕ |
|---|---|---|
| 89.0K | 1.73% | |
| 64.7K | 8.82% | |
| 326.4K | 4.35% | |
| 59.9K | 1.94% | |
| 6.8M | 17.39% | |
| 252.6K | 4.27% | |
| 196.3K | 5.42% | |
| 45.7K | 4.38% | |
| 37.8K | 5.51% | |
| 763.6K | 3.32% | |
| 515.4K | 5% | |
| 803.3K | 56.14% | |
| 42.6K | 2.14% | |
| 828.8K | 6.62% | |
| 195.1K | 2.83% | |
| 97.9K | 3% | |
| 110.2K | 3.74% | |
| 88.1K | 1.94% | |
| 99.7K | 2.19% | |
| 23.2K | 1.66% | |
| 463.3K | 7.48% | |
| 538.4K | 7.67% | |
| 390.9K | 3.89% | |
| 330.7K | 6% | |
| 39.2K | 1.33% | |
| 161.5K | 2.60% | |
| 15.6K | 1.37% | |
| 62.5K | 3.14% | |
| 320.6K | 10% | |
| 47.7K | 3.40% | |
| 949.0K | 10.18% | |
| 48.9K | 2.31% | |
| 1.9M | 9.68% | |
| 377.9K | 3.44% | |
| 16.4K | 2.07% | |
| 344.1K | 2.91% | |
| 116.7K | 2.85% | |
| 258.2K | 6.11% | |
| 532.3K | 4.11% | |
| 45.5K | 4.14% | |
| 110.7K | 2.03% | |
| 16.1K | 1.73% | |
| 155.6K | 2.16% | |
| 1.7M | 5.35% | |
| 112.4K | 3.25% | |
| 15.0K | 2.31% | |
| 691.4K | 7.90% | |
| 854.6K | 10.90% | |
| 20.8K | 1.18% | |
| 203.1K | 3.42% | |
| 9.2K | 1.57% |
Heading the list from our data set is California, boasting an impressive total Asian population of 6.8 million. This makes California the state with the largest concentration of Asian-Americans by far, a testament to its rich history of immigration and cultural diversity.
Second on the list is the state of New York, home to approximately 1.9 million Asian-Americans. New York City, in particular, has a prominent Asian presence made evident by neighborhoods such as Chinatown, Koreatown, and Little India which emphasize the state's cultural wealth.
Landing third is Texas, with a significant Asian population of around 1.7 million. Texas' growing economy and multicultural cities make it a sought-after destination for immigrants. New Jersey ranks fourth, hosting approximately 949,000 Asian-Americans. Asian influence can be seen in cities such as Jersey City with its bustling "Little India" neighborhood. Washington fills the fifth spot, harboring approximately 854,600 Asian-Americans, underlining the trend of higher Asian-American presence on the West Coast.
Illinois and Hawaii feature next with sizable Asian populations of around 828,800 and 803,300 respectively, followed by Florida and Virginia, each with a population of over 690,000. Wrapping up our top 10 list is Massachusetts, home to roughly 538,400 Asian-Americans.
States with Most Asian Population:
Ranked in U.S.
#33
% of Population
1.73%
Ranked in U.S.
#46
Ranked in U.S.
#35
% of Population
8.82%
Ranked in U.S.
#7
326.4K
Ranked in U.S.
#18
% of Population
4.35%
Ranked in U.S.
#19
Ranked in U.S.
#37
% of Population
1.94%
Ranked in U.S.
#44
Ranked in U.S.
#1
% of Population
17.39%
Ranked in U.S.
#2
252.6K
Ranked in U.S.
#21
% of Population
4.27%
Ranked in U.S.
#20
196.3K
Ranked in U.S.
#23
% of Population
5.42%
Ranked in U.S.
#15
Ranked in U.S.
#40
% of Population
4.38%
Ranked in U.S.
#18
Ranked in U.S.
#44
% of Population
5.51%
Ranked in U.S.
#14
763.6K
Ranked in U.S.
#8
% of Population
3.32%
Ranked in U.S.
#28
515.4K
Ranked in U.S.
#12
% of Population
5%
Ranked in U.S.
#17
803.3K
Ranked in U.S.
#7
% of Population
56.14%
Ranked in U.S.
#1
Ranked in U.S.
#42
% of Population
2.14%
Ranked in U.S.
#40
828.8K
Ranked in U.S.
#6
% of Population
6.62%
Ranked in U.S.
#11
195.1K
Ranked in U.S.
#24
% of Population
2.83%
Ranked in U.S.
#34
Ranked in U.S.
#32
% of Population
3%
Ranked in U.S.
#31
110.2K
Ranked in U.S.
#30
% of Population
3.74%
Ranked in U.S.
#24
Ranked in U.S.
#34
% of Population
1.94%
Ranked in U.S.
#43
Ranked in U.S.
#31
% of Population
2.19%
Ranked in U.S.
#38
Ranked in U.S.
#45
% of Population
1.66%
Ranked in U.S.
#47
463.3K
Ranked in U.S.
#13
% of Population
7.48%
Ranked in U.S.
#10
538.4K
Ranked in U.S.
#10
% of Population
7.67%
Ranked in U.S.
#9
390.9K
Ranked in U.S.
#14
% of Population
3.89%
Ranked in U.S.
#23
330.7K
Ranked in U.S.
#17
% of Population
6%
Ranked in U.S.
#13
Ranked in U.S.
#43
% of Population
1.33%
Ranked in U.S.
#50
161.5K
Ranked in U.S.
#25
% of Population
2.60%
Ranked in U.S.
#35
Ranked in U.S.
#49
% of Population
1.37%
Ranked in U.S.
#49
Ranked in U.S.
#36
% of Population
3.14%
Ranked in U.S.
#30
320.6K
Ranked in U.S.
#19
% of Population
10%
Ranked in U.S.
#5
Ranked in U.S.
#39
% of Population
3.40%
Ranked in U.S.
#27
949.0K
Ranked in U.S.
#4
% of Population
10.18%
Ranked in U.S.
#4
Ranked in U.S.
#38
% of Population
2.31%
Ranked in U.S.
#36
Ranked in U.S.
#2
% of Population
9.68%
Ranked in U.S.
#6
377.9K
Ranked in U.S.
#15
% of Population
3.44%
Ranked in U.S.
#25
Ranked in U.S.
#47
% of Population
2.07%
Ranked in U.S.
#41
344.1K
Ranked in U.S.
#16
% of Population
2.91%
Ranked in U.S.
#32
116.7K
Ranked in U.S.
#27
% of Population
2.85%
Ranked in U.S.
#33
258.2K
Ranked in U.S.
#20
% of Population
6.11%
Ranked in U.S.
#12
532.3K
Ranked in U.S.
#11
% of Population
4.11%
Ranked in U.S.
#22
Ranked in U.S.
#41
% of Population
4.14%
Ranked in U.S.
#21
110.7K
Ranked in U.S.
#29
% of Population
2.03%
Ranked in U.S.
#42
Ranked in U.S.
#48
% of Population
1.73%
Ranked in U.S.
#45
155.6K
Ranked in U.S.
#26
% of Population
2.16%
Ranked in U.S.
#39
Ranked in U.S.
#3
% of Population
5.35%
Ranked in U.S.
#16
112.4K
Ranked in U.S.
#28
% of Population
3.25%
Ranked in U.S.
#29
Ranked in U.S.
#50
% of Population
2.31%
Ranked in U.S.
#37
691.4K
Ranked in U.S.
#9
% of Population
7.90%
Ranked in U.S.
#8
854.6K
Ranked in U.S.
#5
% of Population
10.90%
Ranked in U.S.
#3
Ranked in U.S.
#46
% of Population
1.18%
Ranked in U.S.
#51
203.1K
Ranked in U.S.
#22
% of Population
3.42%
Ranked in U.S.
#26
Ranked in U.S.
#51
% of Population
1.57%
Ranked in U.S.
#48