Maine
See More
Ranked in U.S.
#9
Last updated September 18, 2024
| 1. | New Hampshire | 4.83 | |
| 2. | Delaware | 4.01 | |
| 3. | District of Columbia | 3.79 | |
| 4. | Nevada | 3.43 | |
| 5. | Montana | 3.32 | |
| 6. | North Dakota | 3.26 | |
| 7. | Vermont | 3.22 | |
| 8. | Wisconsin | 3.11 | |
| 9. | Maine | 2.99 | |
| 10. | Colorado | 2.97 | |
| 11. | Wyoming | 2.94 | |
| 12. | Minnesota | 2.85 | |
| 13. | Alaska | 2.83 | |
| 14. | Florida | 2.74 | |
| 15. | Hawaii | 2.71 | |
| 16. | Oregon | 2.71 | |
| 17. | Rhode Island | 2.71 | |
| 18. | Missouri | 2.68 | |
| 19. | California | 2.63 | |
| 20. | New Jersey | 2.63 | |
| 21. | Massachusetts | 2.62 | |
| 22. | Louisiana | 2.59 | |
| 23. | Michigan | 2.53 | |
| 24. | Connecticut | 2.5 | |
| 25. | Illinois | 2.42 | |
| 26. | Texas | 2.41 | |
| 27. | Mississippi | 2.39 | |
| 28. | Indiana | 2.34 | |
| 29. | Iowa | 2.34 | |
| 30. | South Dakota | 2.34 | |
| 31. | Pennsylvania | 2.32 | |
| 32. | North Carolina | 2.31 | |
| 33. | New Mexico | 2.3 | |
| 34. | Tennessee | 2.3 | |
| 35. | Virginia | 2.27 | |
| 36. | Washington | 2.26 | |
| 37. | Arizona | 2.24 | |
| 38. | New York | 2.22 | |
| 39. | Nebraska | 2.17 | |
| 40. | Maryland | 2.15 | |
| 41. | Kansas | 2.12 | |
| 42. | Kentucky | 2.12 | |
| 43. | Ohio | 2.12 | |
| 44. | South Carolina | 2.12 | |
| 45. | Idaho | 2.1 | |
| 46. | Alabama | 2.08 | |
| 47. | Arkansas | 1.92 | |
| 48. | Georgia | 1.91 | |
| 49. | Oklahoma | 1.85 | |
| 50. | West Virginia | 1.82 | |
| 51. | Utah | 1.36 |
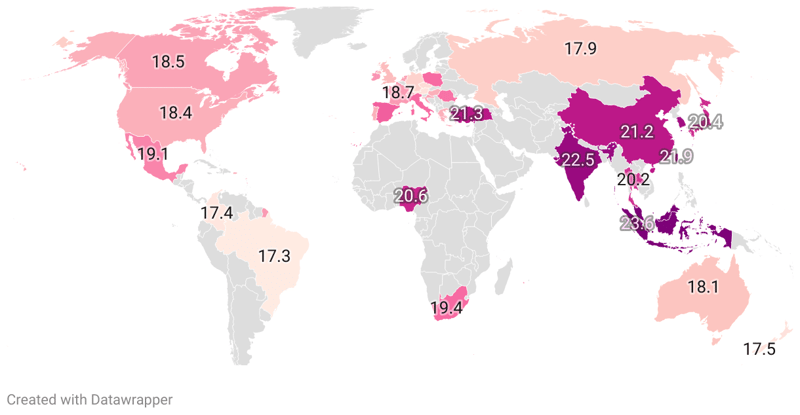
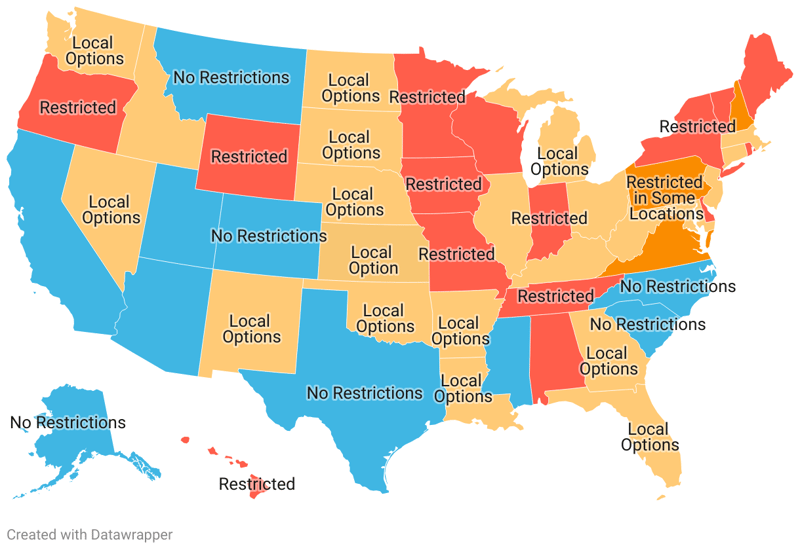
Alcohol consumption is a measure of societal habits across the United States, reflecting not only personal choices but also regional characteristics, economic factors, and cultural influences. According to the National Institute on Alcohol Abuse and Alcoholism, Americans consumed a remarkable 7.9 billion gallons of alcohol in 2020, highlighting the country's increasing appetite for alcohol since 1995. Within this context, this article examines ethanol per capita by state, offering an in-depth understanding of drinking trends across the United States. Several key findings have emerged from the data:
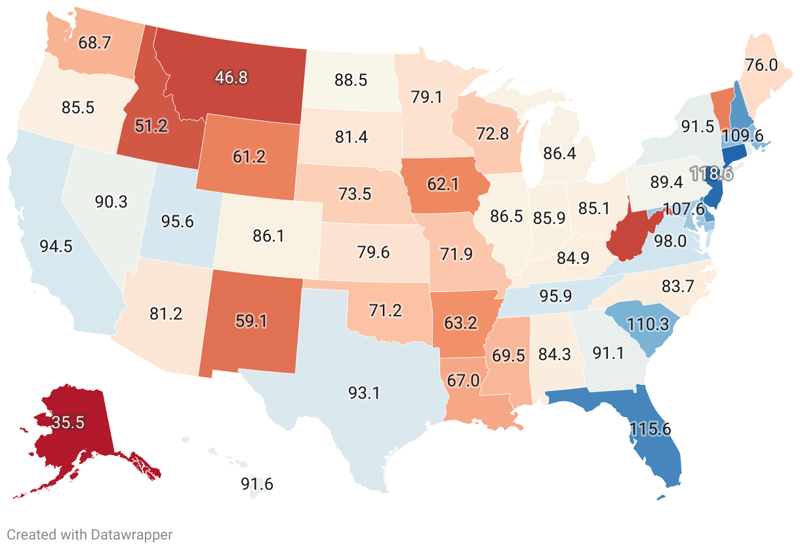
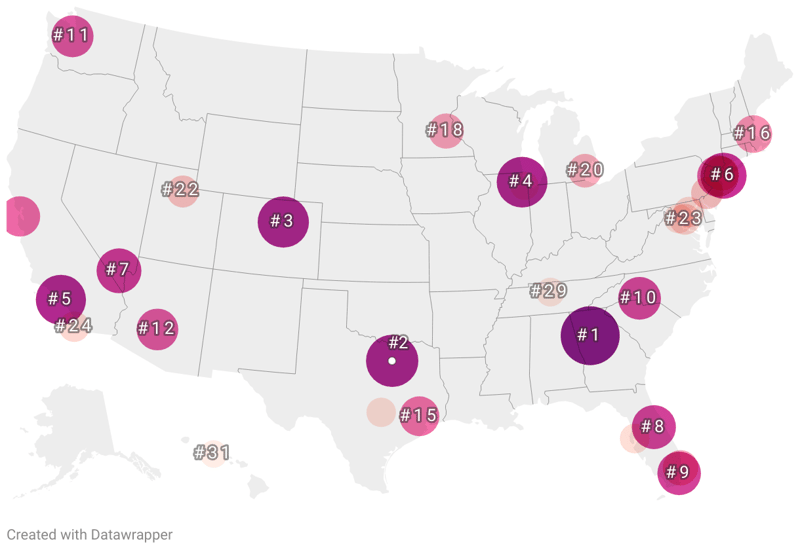
The states that top the list for the highest per capita alcohol consumption span across different regions in the USA. Notably, the northern New England state, New Hampshire, takes the cake for being the state with the highest per capita alcohol consumption, with 4.83 gallons per head per year. Delaware, a Mid-Atlantic state is not far behind with a per capita consumption level of 4.01 gallons, followed by the District of Columbia with a per capita alcohol consumption of 3.79 gallons. Western states also record substantial per capita consumption figures. Nevada, known for its lax liquor laws, ranks 4th with 3.43 gallons per head, while Montana follows closely with an average alcohol consumption of 3.32 gallons per person. North Dakota, despite its relatively small population, accounts for a significant ethanol per capita at 3.26 gallons. Nestled in New England, Vermont ranks 7th with a per capita consumption of 3.22 gallons. Going further north, Wisconsin - a state known for its cheese and beer, stands at 8th position with a rate of 3.11 gallons, followed by its neighbor, Maine with a consumption of 2.99 gallons per head. States that Consume the Most Alcohol (gallons per capita):
Leading the list with the least per capita alcohol consumption is the state of Utah, registering a significantly low figure of 1.36 gallons. This owes to Utah's unique demographic makeup, largely influenced by the Church of Jesus Christ of Latter-Day Saints, which advises its members against alcohol consumption.
West Virginia follows with a similarly low per capita consumption of 1.82 gallons. Oklahoma, located in the South, mirrors this trend, categorizing a per capita consumption of 1.85 gallons.
Next, we have Georgia with an ethanol consumption of 1.91 gallons per capita and Arkansas with 1.92 gallons. Alabama is slightly above with 2.08 gallons. Idaho, though geographically distant from these states, shares a similar trait with a per capita alcohol consumption of 2.1 gallons.
Finally, Kentucky, South Carolina, and Ohio each have corresponding per capita ethanol consumption of 2.12 gallons. These measurements reveal a counterintuitive facet of alcohol consumption in America, given the South's overall volume of alcohol consumption.
States with the least per capita alcohol consumption are:
Ranked in U.S.
#46
Ranked in U.S.
#13
Ranked in U.S.
#37
Ranked in U.S.
#47
Ranked in U.S.
#19
Ranked in U.S.
#10
Ranked in U.S.
#24
Ranked in U.S.
#2
Ranked in U.S.
#3
Ranked in U.S.
#14
Ranked in U.S.
#48
Ranked in U.S.
#15
Ranked in U.S.
#45
Ranked in U.S.
#25
Ranked in U.S.
#28
Ranked in U.S.
#29
Ranked in U.S.
#41
Ranked in U.S.
#42
Ranked in U.S.
#22
Ranked in U.S.
#9
Ranked in U.S.
#40
Ranked in U.S.
#21
Ranked in U.S.
#23
Ranked in U.S.
#12
Ranked in U.S.
#27
Ranked in U.S.
#18
Ranked in U.S.
#5
Ranked in U.S.
#39
Ranked in U.S.
#4
Ranked in U.S.
#1
Ranked in U.S.
#20
Ranked in U.S.
#33
Ranked in U.S.
#38
Ranked in U.S.
#32
Ranked in U.S.
#6
Ranked in U.S.
#43
Ranked in U.S.
#49
Ranked in U.S.
#16
Ranked in U.S.
#31
Ranked in U.S.
#17
Ranked in U.S.
#44
Ranked in U.S.
#30
Ranked in U.S.
#34
Ranked in U.S.
#26
Ranked in U.S.
#51
Ranked in U.S.
#7
Ranked in U.S.
#35
Ranked in U.S.
#36
Ranked in U.S.
#50
Ranked in U.S.
#8
Ranked in U.S.
#11
| Region ↕ | Ethanol per Capita (Gallons)↕ |
|---|---|
| 2.08 | |
| 2.83 | |
| 2.24 | |
| 1.92 | |
| 2.63 | |
| 2.97 | |
| 2.5 | |
| 4.01 | |
| 3.79 | |
| 2.74 | |
| 1.91 | |
| 2.71 | |
| 2.1 | |
| 2.42 | |
| 2.34 | |
| 2.34 | |
| 2.12 | |
| 2.12 | |
| 2.59 | |
| 2.99 | |
| 2.15 | |
| 2.62 | |
| 2.53 | |
| 2.85 | |
| 2.39 | |
| 2.68 | |
| 3.32 | |
| 2.17 | |
| 3.43 | |
| 4.83 | |
| 2.63 | |
| 2.3 | |
| 2.22 | |
| 2.31 | |
| 3.26 | |
| 2.12 | |
| 1.85 | |
| 2.71 | |
| 2.32 | |
| 2.71 | |
| 2.12 | |
| 2.34 | |
| 2.3 | |
| 2.41 | |
| 1.36 | |
| 3.22 | |
| 2.27 | |
| 2.26 | |
| 1.82 | |
| 3.11 | |
| 2.94 |